
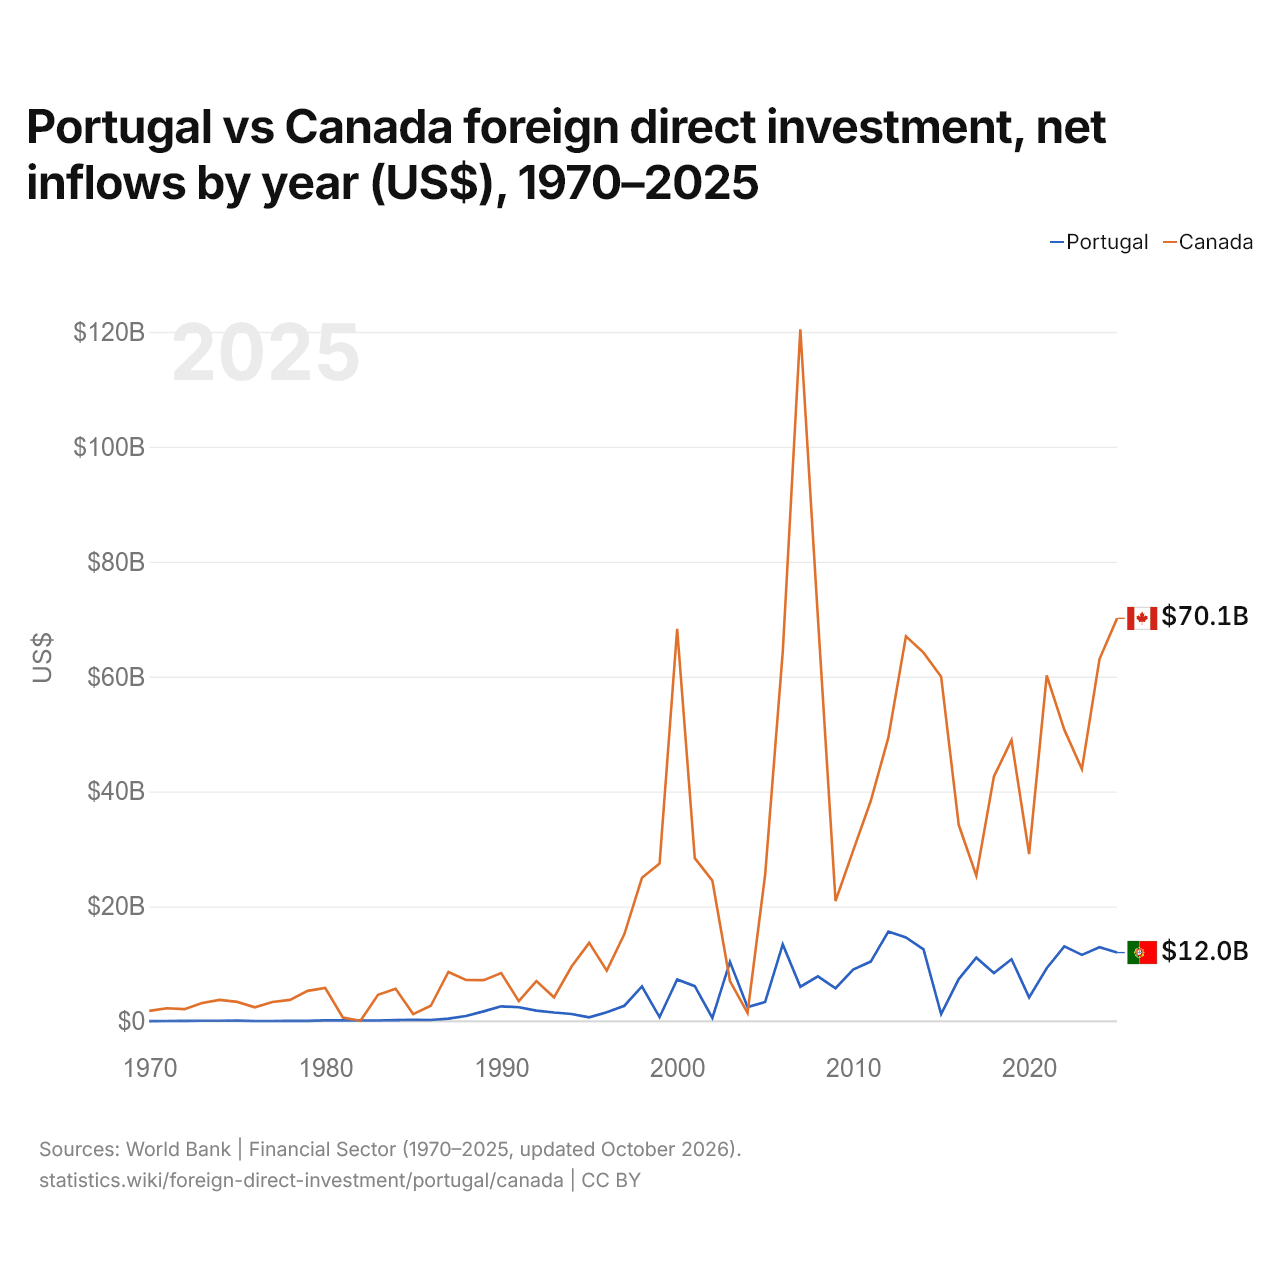
Portugal vs Canada : investissements directs étrangers, entrées nettes par année ($ US), 1970–2025
| Année | $ US | |
|---|---|---|
 Portugal |
 Canada |
|
| 2025 | 11 968 828 949 $ US | 70 134 322 394 $ US |
| 2024 | 12 908 896 806 $ US | 63 052 828 220 $ US |
| 2023 | 11 565 129 636 $ US | 43 897 082 060 $ US |
| 2022 | 13 059 930 356 $ US | 50 764 048 301 $ US |
| 2021 | 9 239 418 034 $ US | 60 189 690 112 $ US |
| 2020 | 4 165 618 741 $ US | 29 123 011 879 $ US |
| 2019 | 10 814 567 641 $ US | 48 942 300 762 $ US |
| 2018 | 8 390 559 335 $ US | 42 603 762 049 $ US |
| 2017 | 11 088 239 862 $ US | 25 357 801 000 $ US |
| 2016 | 7 350 311 647 $ US | 34 201 872 161 $ US |
| 2015 | 1 264 336 593 $ US | 59 986 208 237 $ US |
| 2014 | 12 512 849 287 $ US | 64 174 605 786 $ US |
| 2013 | 14 590 189 382 $ US | 67 027 866 778 $ US |
| 2012 | 15 623 883 335 $ US | 49 368 985 104 $ US |
| 2011 | 10 397 474 492 $ US | 38 338 330 427 $ US |
| 2010 | 8 998 318 742 $ US | 29 714 744 325 $ US |
| 2009 | 5 752 968 835 $ US | 20 951 090 410 $ US |
| 2008 | 7 820 637 676 $ US | 70 119 614 333 $ US |
| 2007 | 6 014 642 427 $ US | 120 451 484 862 $ US |
| 2006 | 13 394 502 768 $ US | 64 302 303 097 $ US |
| 2005 | 3 367 937 007 $ US | 25 552 226 941 $ US |
| 2004 | 2 485 161 769 $ US | 1 452 416 545 $ US |
| 2003 | 10 354 679 114 $ US | 7 011 792 709 $ US |
| 2002 | 587 893 730 $ US | 24 486 425 377 $ US |
| 2001 | 6 113 785 654 $ US | 28 391 098 831 $ US |
| 2000 | 7 292 581 671 $ US | 68 303 350 856 $ US |
| 1999 | 740 701 804 $ US | 27 456 044 687 $ US |
| 1998 | 6 071 328 303 $ US | 24 979 208 298 $ US |
| 1997 | 2 710 655 380 $ US | 15 182 400 422 $ US |
| 1996 | 1 571 447 865 $ US | 8 817 677 647 $ US |
| 1995 | 684 572 214 $ US | 13 657 593 613 $ US |
| 1994 | 1 269 714 976 $ US | 9 541 029 102 $ US |
| 1993 | 1 533 880 551 $ US | 4 178 460 317 $ US |
| 1992 | 1 873 428 553 $ US | 7 018 240 063 $ US |
| 1991 | 2 448 454 131 $ US | 3 514 220 103 $ US |
| 1990 | 2 609 986 421 $ US | 8 401 707 941 $ US |
| 1989 | 1 736 891 397 $ US | 7 171 648 940 $ US |
| 1988 | 921 583 433 $ US | 7 196 400 040 $ US |
| 1987 | 465 868 833 $ US | 8 597 306 054 $ US |
| 1986 | 238 151 216 $ US | 2 709 677 621 $ US |
| 1985 | 274 036 105 $ US | 1 256 760 214 $ US |
| 1984 | 198 221 489 $ US | 5 675 261 449 $ US |
| 1983 | 146 837 897 $ US | 4 618 560 062 $ US |
| 1982 | 144 033 052 $ US | 90 061 244 $ US |
| 1981 | 174 486 586 $ US | 663 720 808 $ US |
| 1980 | 156 950 738 $ US | 5 813 268 735 $ US |
| 1979 | 78 304 051 $ US | 5 307 737 031 $ US |
| 1978 | 65 993 577 $ US | 3 740 191 708 $ US |
| 1977 | 57 914 758 $ US | 3 371 826 624 $ US |
| 1976 | 62 999 101 $ US | 2 450 721 216 $ US |
| 1975 | 115 351 291 $ US | 3 386 183 403 $ US |
| 1974 | 106 000 000 $ US | 3 723 538 435 $ US |
| 1973 | 95 000 000 $ US | 3 184 571 501 $ US |
| 1972 | 73 000 000 $ US | 2 110 873 961 $ US |
| 1971 | 56 000 000 $ US | 2 273 318 428 $ US |
| 1970 | 28 900 000 $ US | 1 827 117 680 $ US |
En 2025, les entrées nettes d'investissements directs étrangers étaient de 12 milliards de dollars au Portugal et de 70,1 milliards de dollars au Canada : 5,9 fois plus au Canada. En 1970, elles étaient de 28,9 millions de dollars au Portugal et de 1,83 milliard de dollars au Canada.
Les entrées nettes d'investissements directs étrangers au Portugal ont été supérieures à celles du Canada pendant 3 des 56 années de 1970 à 2025, et inférieures pendant 53.
Portugal vs Canada : dernières entrées et sorties d'investissements étrangers
|
Portugal
|
Canada
|
|
|---|---|---|
| Entrées nettes | +12,0 Md $US | +70,1 Md $US |
| Entrées nettes, % du PIB | +3,5 % | +3,0 % |
| Sorties nettes | +8,91 Md $US | +56,9 Md $US |
| Entrées nettes, total 2016–2025 | +101 Md $US | +468 Md $US |
| Rang mondial | 32/192 | 7/192 |
Comparer les investissements directs étrangers de 2 pays au choix
Sources :
- Banque mondiale | Secteur financier (1970–2025, mis à jour en octobre 2026)
Creative Commons Attribution (CC BY) : vous pouvez copier, partager, adapter et réutiliser ce contenu, y compris à des fins commerciales, à condition de citer statistics.wiki et d’indiquer les modifications apportées. Les sources citées ci-dessus peuvent avoir leurs propres conditions de licence.