
Canada vs Brunei : investissements directs étrangers, entrées nettes par année ($ US), 1970–2025
| Année | $ US | |
|---|---|---|
 Canada |
 Brunei |
|
| 2025 | 70 134 322 394 $ US | 61 805 866 $ US |
| 2024 | 63 052 828 220 $ US | 29 063 019 $ US |
| 2023 | 43 897 082 060 $ US | −55 927 970 $ US |
| 2022 | 50 764 048 301 $ US | −290 169 985 $ US |
| 2021 | 60 189 690 112 $ US | 206 462 739 $ US |
| 2020 | 29 123 011 879 $ US | 565 542 275 $ US |
| 2019 | 48 942 300 762 $ US | 373 256 767 $ US |
| 2018 | 42 603 762 049 $ US | 516 202 621 $ US |
| 2017 | 25 357 801 000 $ US | 467 927 550 $ US |
| 2016 | 34 201 872 161 $ US | −150 550 827 $ US |
| 2015 | 59 986 208 237 $ US | 171 289 168 $ US |
| 2014 | 64 174 605 786 $ US | 573 906 208 $ US |
| 2013 | 67 027 866 778 $ US | 775 641 999 $ US |
| 2012 | 49 368 985 104 $ US | 864 905 528 $ US |
| 2011 | 38 338 330 427 $ US | 691 170 274 $ US |
| 2010 | 29 714 744 325 $ US | 480 722 547 $ US |
| 2009 | 20 951 090 410 $ US | 325 586 828 $ US |
| 2008 | 70 119 614 333 $ US | 222 184 549 $ US |
| 2007 | 120 451 484 862 $ US | 257 635 717 $ US |
| 2006 | 64 302 303 097 $ US | 87 839 128 $ US |
| 2005 | 25 552 226 941 $ US | 175 068 517 $ US |
| 2004 | 1 452 416 545 $ US | 113 205 867 $ US |
| 2003 | 7 011 792 709 $ US | 123 820 911 $ US |
| 2002 | 24 486 425 377 $ US | 229 671 956 $ US |
| 2001 | 28 391 098 831 $ US | 60 694 644 $ US |
| 2000 | 68 303 350 856 $ US | 549 607 251 $ US |
| 1999 | 27 456 044 687 $ US | 747 868 669 $ US |
| 1998 | 24 979 208 298 $ US | 573 250 000 $ US |
| 1997 | 15 182 400 422 $ US | 701 740 000 $ US |
| 1996 | 8 817 677 647 $ US | 653 600 000 $ US |
| 1995 | 13 657 593 613 $ US | 582 760 563 $ US |
| 1994 | 9 541 029 102 $ US | 5 890 000 $ US |
| 1993 | 4 178 460 317 $ US | 8 000 000 $ US |
| 1992 | 7 018 240 063 $ US | 7 000 000 $ US |
| 1991 | 3 514 220 103 $ US | 5 000 000 $ US |
| 1990 | 8 401 707 941 $ US | 7 000 000 $ US |
| 1989 | 7 171 648 940 $ US | 10 000 000 $ US |
| 1988 | 7 196 400 040 $ US | 460 000 $ US |
| 1987 | 8 597 306 054 $ US | −70 000 $ US |
| 1986 | 2 709 677 621 $ US | −6 050 000 $ US |
| 1985 | 1 256 760 214 $ US | 3 670 000 $ US |
| 1984 | 5 675 261 449 $ US | 800 000 $ US |
| 1983 | 4 618 560 062 $ US | 3 620 000 $ US |
| 1982 | 90 061 244 $ US | 6 210 000 $ US |
| 1981 | 663 720 808 $ US | −11 110 000 $ US |
| 1980 | 5 813 268 735 $ US | −19 570 000 $ US |
| 1979 | 5 307 737 031 $ US | 350 000 $ US |
| 1978 | 3 740 191 708 $ US | 4 570 000 $ US |
| 1977 | 3 371 826 624 $ US | −3 290 000 $ US |
| 1976 | 2 450 721 216 $ US | −30 890 000 $ US |
| 1975 | 3 386 183 403 $ US | 850 000 $ US |
| 1974 | 3 723 538 435 $ US | 2 080 000 $ US |
| 1973 | 3 184 571 501 $ US | 290 000 $ US |
| 1972 | 2 110 873 961 $ US | −3 780 000 $ US |
| 1971 | 2 273 318 428 $ US | −17 550 000 $ US |
| 1970 | 1 827 117 680 $ US | 85 530 000 $ US |
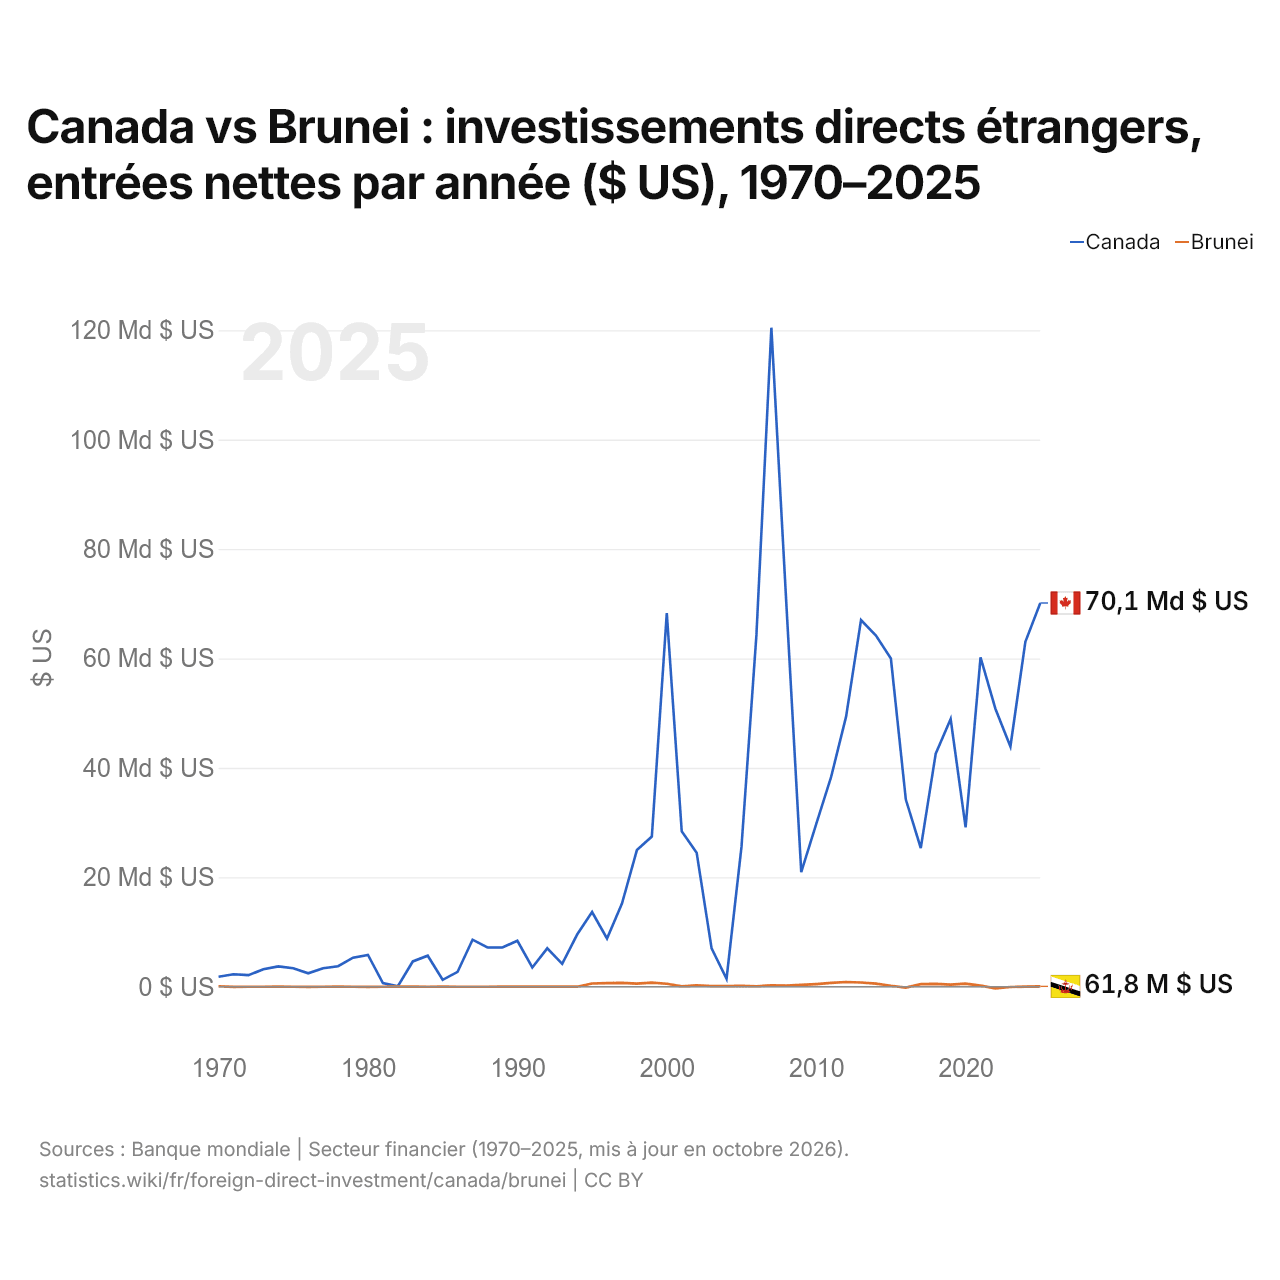
En 2025, les entrées nettes d'investissements directs étrangers étaient de 70,1 milliards de dollars au Canada et de 61,8 millions de dollars au Brunei : 1 100 fois plus au Canada. En 1970, elles étaient de 1,83 milliard de dollars au Canada et de 85,5 millions de dollars au Brunei.
Les entrées nettes d'investissements directs étrangers au Canada ont été supérieures à celles du Brunei chacune des 56 années de 1970 à 2025.
Canada vs Brunei : dernières entrées et sorties d'investissements étrangers
|
Canada
|
Brunei
|
|
|---|---|---|
| Entrées nettes | +70,1 Md $US | +61,8 M $US |
| Entrées nettes, % du PIB | +3,0 % | +0,4 % |
| Sorties nettes | +56,9 Md $US | −95,4 M $US |
| Entrées nettes, total 2016–2025 | +468 Md $US | +1,72 Md $US |
| Rang mondial | 7/192 | 150/192 |
Comparer les investissements directs étrangers de 2 pays au choix
Sources :
- Banque mondiale | Secteur financier (1970–2025, mis à jour en octobre 2026)
Creative Commons Attribution (CC BY) : vous pouvez copier, partager, adapter et réutiliser ce contenu, y compris à des fins commerciales, à condition de citer statistics.wiki et d’indiquer les modifications apportées. Les sources citées ci-dessus peuvent avoir leurs propres conditions de licence.