
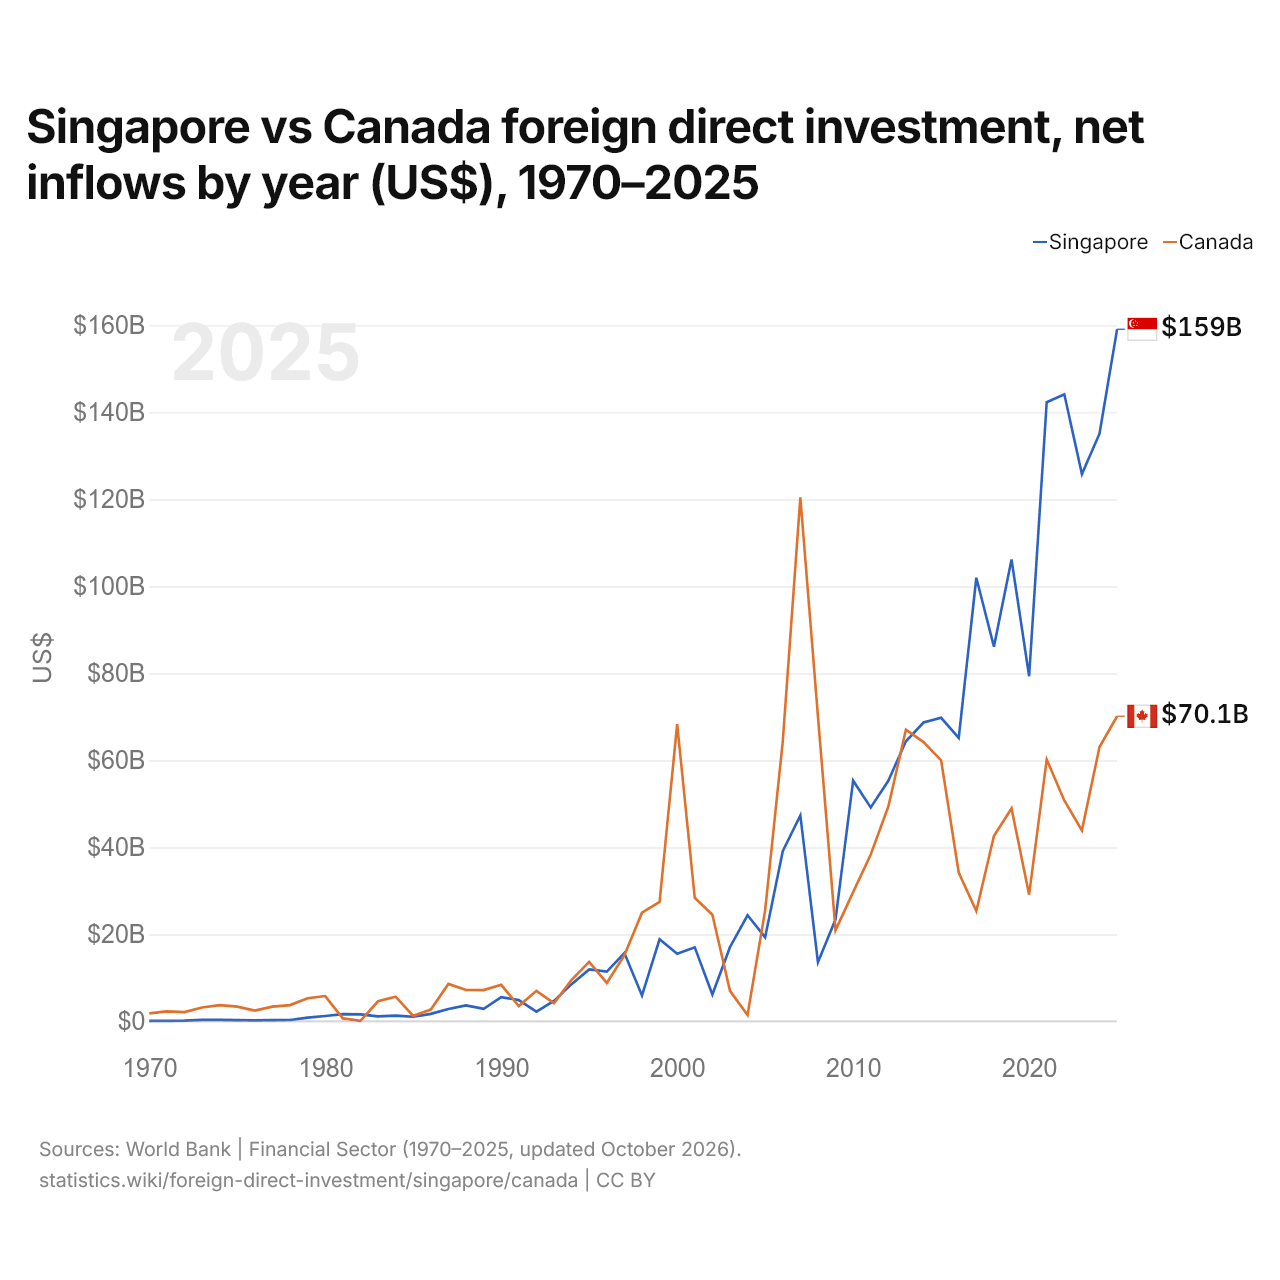
Singapour vs Canada : investissements directs étrangers, entrées nettes par année ($ US), 1970–2025
| Année | $ US | |
|---|---|---|
 Singapour |
 Canada |
|
| 2025 | 159 087 766 263 $ US | 70 134 322 394 $ US |
| 2024 | 135 077 157 183 $ US | 63 052 828 220 $ US |
| 2023 | 125 786 783 507 $ US | 43 897 082 060 $ US |
| 2022 | 144 147 823 985 $ US | 50 764 048 301 $ US |
| 2021 | 142 313 339 702 $ US | 60 189 690 112 $ US |
| 2020 | 79 322 385 229 $ US | 29 123 011 879 $ US |
| 2019 | 106 174 185 548 $ US | 48 942 300 762 $ US |
| 2018 | 86 126 491 249 $ US | 42 603 762 049 $ US |
| 2017 | 101 970 056 303 $ US | 25 357 801 000 $ US |
| 2016 | 65 133 174 223 $ US | 34 201 872 161 $ US |
| 2015 | 69 774 553 125 $ US | 59 986 208 237 $ US |
| 2014 | 68 698 472 831 $ US | 64 174 605 786 $ US |
| 2013 | 64 389 514 904 $ US | 67 027 866 778 $ US |
| 2012 | 55 310 807 548 $ US | 49 368 985 104 $ US |
| 2011 | 49 155 657 316 $ US | 38 338 330 427 $ US |
| 2010 | 55 322 434 162 $ US | 29 714 744 325 $ US |
| 2009 | 23 436 064 060 $ US | 20 951 090 410 $ US |
| 2008 | 13 598 298 537 $ US | 70 119 614 333 $ US |
| 2007 | 47 337 947 783 $ US | 120 451 484 862 $ US |
| 2006 | 39 129 332 047 $ US | 64 302 303 097 $ US |
| 2005 | 19 316 058 814 $ US | 25 552 226 941 $ US |
| 2004 | 24 390 254 966 $ US | 1 452 416 545 $ US |
| 2003 | 17 051 420 153 $ US | 7 011 792 709 $ US |
| 2002 | 6 157 194 144 $ US | 24 486 425 377 $ US |
| 2001 | 17 006 818 857 $ US | 28 391 098 831 $ US |
| 2000 | 15 515 295 182 $ US | 68 303 350 856 $ US |
| 1999 | 18 852 989 359 $ US | 27 456 044 687 $ US |
| 1998 | 5 958 646 074 $ US | 24 979 208 298 $ US |
| 1997 | 15 701 783 679 $ US | 15 182 400 422 $ US |
| 1996 | 11 432 363 956 $ US | 8 817 677 647 $ US |
| 1995 | 11 942 852 103 $ US | 13 657 593 613 $ US |
| 1994 | 8 550 165 227 $ US | 9 541 029 102 $ US |
| 1993 | 4 686 312 017 $ US | 4 178 460 317 $ US |
| 1992 | 2 204 342 221 $ US | 7 018 240 063 $ US |
| 1991 | 4 887 094 440 $ US | 3 514 220 103 $ US |
| 1990 | 5 574 738 855 $ US | 8 401 707 941 $ US |
| 1989 | 2 886 591 947 $ US | 7 171 648 940 $ US |
| 1988 | 3 654 794 589 $ US | 7 196 400 040 $ US |
| 1987 | 2 836 204 782 $ US | 8 597 306 054 $ US |
| 1986 | 1 710 283 593 $ US | 2 709 677 621 $ US |
| 1985 | 1 046 746 813 $ US | 1 256 760 214 $ US |
| 1984 | 1 301 871 313 $ US | 5 675 261 449 $ US |
| 1983 | 1 133 905 966 $ US | 4 618 560 062 $ US |
| 1982 | 1 601 850 446 $ US | 90 061 244 $ US |
| 1981 | 1 659 967 735 $ US | 663 720 808 $ US |
| 1980 | 1 235 750 842 $ US | 5 813 268 735 $ US |
| 1979 | 836 031 838 $ US | 5 307 737 031 $ US |
| 1978 | 299 908 752 $ US | 3 740 191 708 $ US |
| 1977 | 291 465 114 $ US | 3 371 826 624 $ US |
| 1976 | 230 690 622 $ US | 2 450 721 216 $ US |
| 1975 | 291 823 051 $ US | 3 386 183 403 $ US |
| 1974 | 340 190 956 $ US | 3 723 538 435 $ US |
| 1973 | 352 816 701 $ US | 3 184 571 501 $ US |
| 1972 | 161 066 667 $ US | 2 110 873 961 $ US |
| 1971 | 116 000 000 $ US | 2 273 318 428 $ US |
| 1970 | 93 000 000 $ US | 1 827 117 680 $ US |
En 2025, les entrées nettes d'investissements directs étrangers étaient de 159 milliards de dollars à Singapour et de 70,1 milliards de dollars au Canada : 2,3 fois plus à Singapour. En 1970, elles étaient de 93 millions de dollars à Singapour et de 1,83 milliard de dollars au Canada.
Les entrées nettes d'investissements directs étrangers à Singapour ont été supérieures à celles du Canada pendant 24 des 56 années de 1970 à 2025, et inférieures pendant 32.
Singapour vs Canada : dernières entrées et sorties d'investissements étrangers
|
Singapour
|
Canada
|
|
|---|---|---|
| Entrées nettes | +159 Md $US | +70,1 Md $US |
| Entrées nettes, % du PIB | +26,3 % | +3,0 % |
| Sorties nettes | +94,2 Md $US | +56,9 Md $US |
| Entrées nettes, total 2016–2025 | +1,15 Bn $US | +468 Md $US |
| Rang mondial | 2/192 | 7/192 |
Comparer les investissements directs étrangers de 2 pays au choix
Sources :
- Banque mondiale | Secteur financier (1970–2025, mis à jour en octobre 2026)
Creative Commons Attribution (CC BY) : vous pouvez copier, partager, adapter et réutiliser ce contenu, y compris à des fins commerciales, à condition de citer statistics.wiki et d’indiquer les modifications apportées. Les sources citées ci-dessus peuvent avoir leurs propres conditions de licence.