
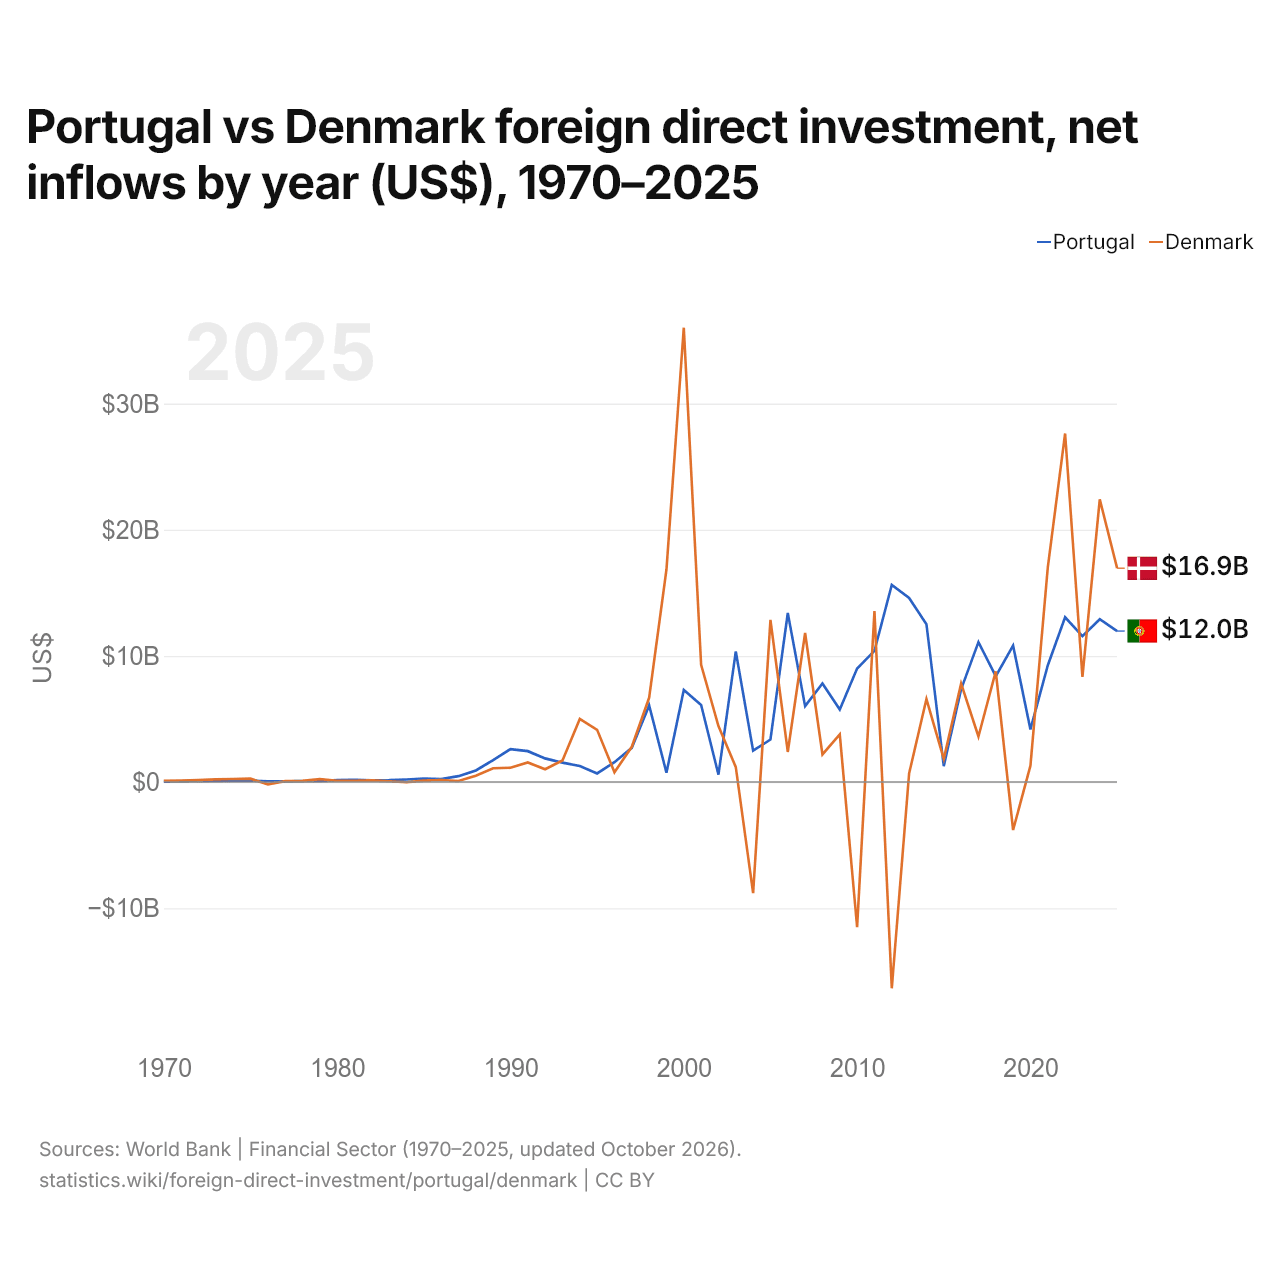
Portugal vs Danemark : investissements directs étrangers, entrées nettes par année ($ US), 1970–2025
| Année | $ US | |
|---|---|---|
 Portugal |
 Danemark |
|
| 2025 | 11 968 828 949 $ US | 16 949 298 439 $ US |
| 2024 | 12 908 896 806 $ US | 22 409 478 779 $ US |
| 2023 | 11 565 129 636 $ US | 8 339 457 436 $ US |
| 2022 | 13 059 930 356 $ US | 27 627 359 889 $ US |
| 2021 | 9 239 418 034 $ US | 16 997 286 703 $ US |
| 2020 | 4 165 618 741 $ US | 1 294 050 740 $ US |
| 2019 | 10 814 567 641 $ US | −3 801 733 789 $ US |
| 2018 | 8 390 559 335 $ US | 8 764 023 726 $ US |
| 2017 | 11 088 239 862 $ US | 3 607 276 300 $ US |
| 2016 | 7 350 311 647 $ US | 7 804 020 827 $ US |
| 2015 | 1 264 336 593 $ US | 1 842 994 663 $ US |
| 2014 | 12 512 849 287 $ US | 6 577 348 987 $ US |
| 2013 | 14 590 189 382 $ US | 680 338 946 $ US |
| 2012 | 15 623 883 335 $ US | −16 349 825 685 $ US |
| 2011 | 10 397 474 492 $ US | 13 558 894 634 $ US |
| 2010 | 8 998 318 742 $ US | −11 501 101 751 $ US |
| 2009 | 5 752 968 835 $ US | 3 779 250 819 $ US |
| 2008 | 7 820 637 676 $ US | 2 191 215 666 $ US |
| 2007 | 6 014 642 427 $ US | 11 809 448 518 $ US |
| 2006 | 13 394 502 768 $ US | 2 385 249 288 $ US |
| 2005 | 3 367 937 007 $ US | 12 847 031 342 $ US |
| 2004 | 2 485 161 769 $ US | −8 804 165 491 $ US |
| 2003 | 10 354 679 114 $ US | 1 184 825 160 $ US |
| 2002 | 587 893 730 $ US | 4 430 703 179 $ US |
| 2001 | 6 113 785 654 $ US | 9 286 404 806 $ US |
| 2000 | 7 292 581 671 $ US | 36 013 297 907 $ US |
| 1999 | 740 701 804 $ US | 16 847 919 226 $ US |
| 1998 | 6 071 328 303 $ US | 6 674 661 469 $ US |
| 1997 | 2 710 655 380 $ US | 2 791 671 359 $ US |
| 1996 | 1 571 447 865 $ US | 773 444 116 $ US |
| 1995 | 684 572 214 $ US | 4 139 423 320 $ US |
| 1994 | 1 269 714 976 $ US | 5 006 178 362 $ US |
| 1993 | 1 533 880 551 $ US | 1 712 766 178 $ US |
| 1992 | 1 873 428 553 $ US | 1 017 385 349 $ US |
| 1991 | 2 448 454 131 $ US | 1 552 515 351 $ US |
| 1990 | 2 609 986 421 $ US | 1 132 146 350 $ US |
| 1989 | 1 736 891 397 $ US | 1 089 565 260 $ US |
| 1988 | 921 583 433 $ US | 503 338 113 $ US |
| 1987 | 465 868 833 $ US | 84 660 817 $ US |
| 1986 | 238 151 216 $ US | 163 266 341 $ US |
| 1985 | 274 036 105 $ US | 111 103 418 $ US |
| 1984 | 198 221 489 $ US | −15 356 842 $ US |
| 1983 | 146 837 897 $ US | 60 130 800 $ US |
| 1982 | 144 033 052 $ US | 133 850 097 $ US |
| 1981 | 174 486 586 $ US | 99 454 250 $ US |
| 1980 | 156 950 738 $ US | 104 119 701 $ US |
| 1979 | 78 304 051 $ US | 223 893 245 $ US |
| 1978 | 65 993 577 $ US | 89 464 875 $ US |
| 1977 | 57 914 758 $ US | 75 799 729 $ US |
| 1976 | 62 999 101 $ US | −190 295 663 $ US |
| 1975 | 115 351 291 $ US | 266 942 015 $ US |
| 1974 | 106 000 000 $ US | 240 000 000 $ US |
| 1973 | 95 000 000 $ US | 212 000 000 $ US |
| 1972 | 73 000 000 $ US | 164 000 000 $ US |
| 1971 | 56 000 000 $ US | 125 000 000 $ US |
| 1970 | 28 900 000 $ US | 104 000 000 $ US |
En 2025, les entrées nettes d'investissements directs étrangers étaient de 12 milliards de dollars au Portugal et de 16,9 milliards de dollars au Danemark : 42 % de plus au Danemark. En 1970, elles étaient de 28,9 millions de dollars au Portugal et de 104 millions de dollars au Danemark.
Les entrées nettes d'investissements directs étrangers au Portugal ont été supérieures à celles du Danemark pendant 28 des 56 années de 1970 à 2025, et inférieures pendant 28.
Portugal vs Danemark : dernières entrées et sorties d'investissements étrangers
|
Portugal
|
Danemark
|
|
|---|---|---|
| Entrées nettes | +12,0 Md $US | +16,9 Md $US |
| Entrées nettes, % du PIB | +3,5 % | +3,7 % |
| Sorties nettes | +8,91 Md $US | +52,8 Md $US |
| Entrées nettes, total 2016–2025 | +101 Md $US | +110 Md $US |
| Rang mondial | 32/192 | 25/192 |
Comparer les investissements directs étrangers de 2 pays au choix
Sources :
- Banque mondiale | Secteur financier (1970–2025, mis à jour en octobre 2026)
Creative Commons Attribution (CC BY) : vous pouvez copier, partager, adapter et réutiliser ce contenu, y compris à des fins commerciales, à condition de citer statistics.wiki et d’indiquer les modifications apportées. Les sources citées ci-dessus peuvent avoir leurs propres conditions de licence.