
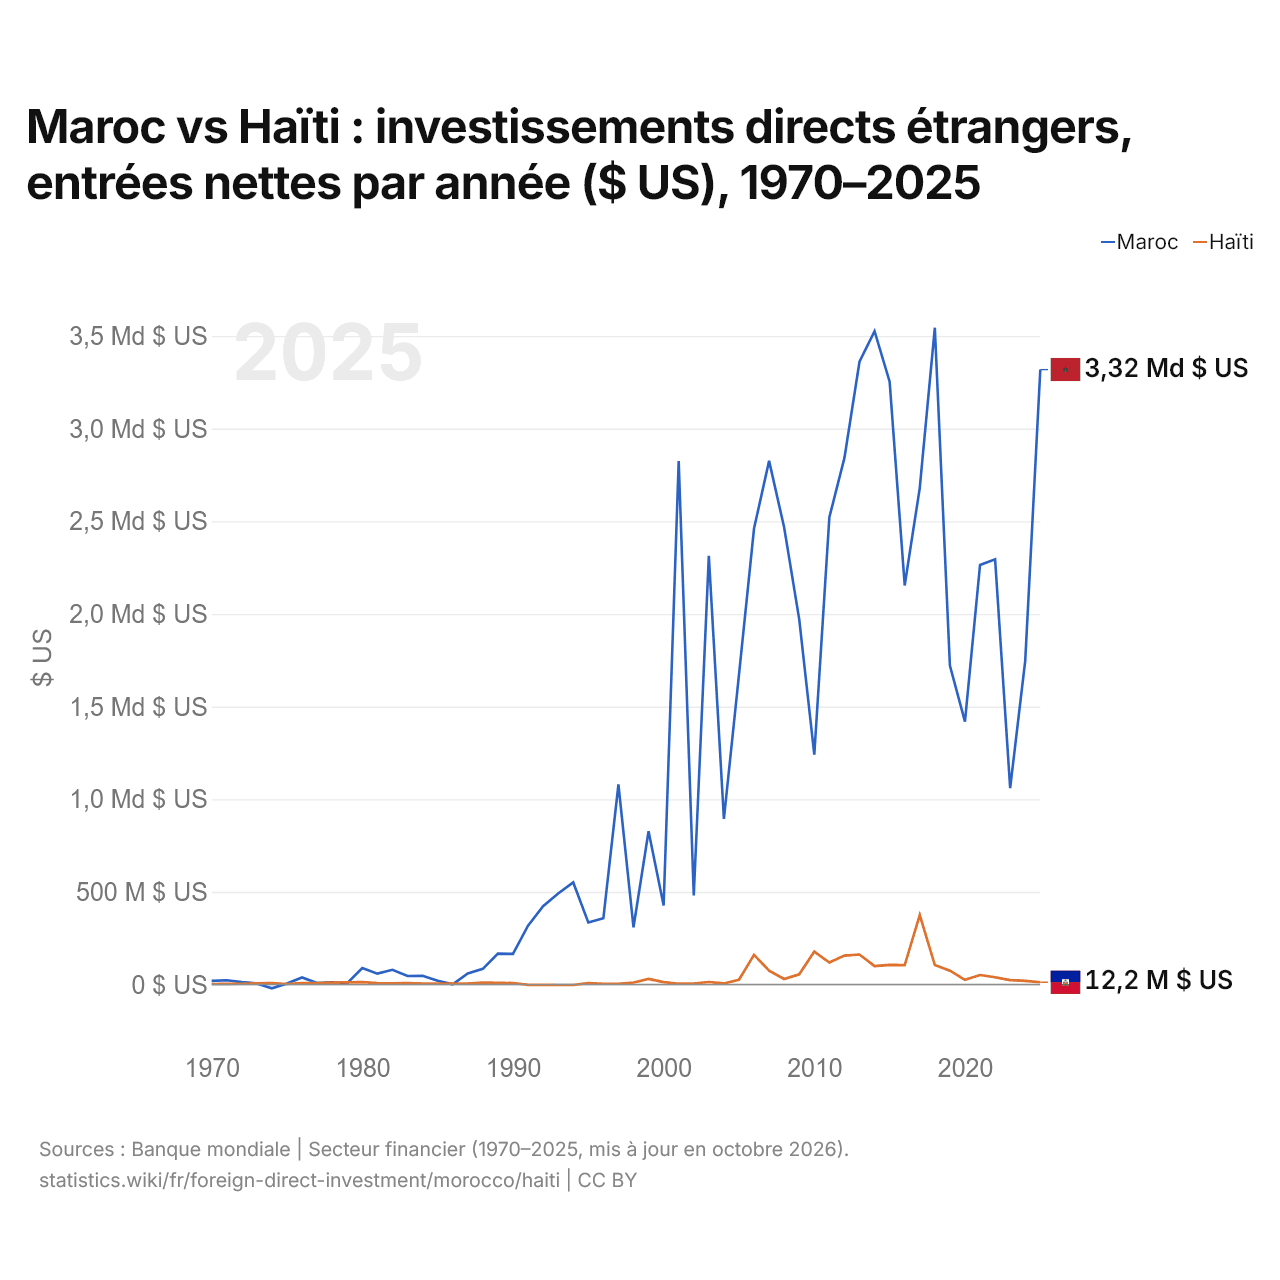
Maroc vs Haïti : investissements directs étrangers, entrées nettes par année ($ US), 1970–2025
| Année | $ US | |
|---|---|---|
 Maroc |
 Haïti |
|
| 2025 | 3 318 381 812 $ US | 12 183 898 $ US |
| 2024 | 1 748 257 754 $ US | 20 001 152 $ US |
| 2023 | 1 060 023 610 $ US | 23 647 920 $ US |
| 2022 | 2 294 356 059 $ US | 39 413 200 $ US |
| 2021 | 2 264 148 625 $ US | 51 299 000 $ US |
| 2020 | 1 418 713 119 $ US | 25 000 000 $ US |
| 2019 | 1 720 825 003 $ US | 75 000 000 $ US |
| 2018 | 3 544 387 229 $ US | 105 000 000 $ US |
| 2017 | 2 680 109 856 $ US | 374 860 000 $ US |
| 2016 | 2 153 363 905 $ US | 104 900 000 $ US |
| 2015 | 3 252 913 902 $ US | 105 680 000 $ US |
| 2014 | 3 525 384 612 $ US | 99 000 000 $ US |
| 2013 | 3 360 909 924 $ US | 161 918 586 $ US |
| 2012 | 2 841 954 371 $ US | 156 000 000 $ US |
| 2011 | 2 521 362 081 $ US | 119 000 000 $ US |
| 2010 | 1 240 625 859 $ US | 178 000 000 $ US |
| 2009 | 1 970 323 920 $ US | 55 470 000 $ US |
| 2008 | 2 466 288 357 $ US | 29 800 000 $ US |
| 2007 | 2 825 801 376 $ US | 74 500 000 $ US |
| 2006 | 2 460 787 164 $ US | 160 600 000 $ US |
| 2005 | 1 670 609 689 $ US | 26 000 000 $ US |
| 2004 | 893 325 393 $ US | 5 900 000 $ US |
| 2003 | 2 312 829 823 $ US | 13 800 000 $ US |
| 2002 | 480 355 698 $ US | 5 700 000 $ US |
| 2001 | 2 824 557 252 $ US | 4 400 000 $ US |
| 2000 | 426 553 284 $ US | 13 250 000 $ US |
| 1999 | 826 974 027 $ US | 30 000 000 $ US |
| 1998 | 308 712 164 $ US | 10 760 000 $ US |
| 1997 | 1 079 341 332 $ US | 4 000 000 $ US |
| 1996 | 357 393 802 $ US | 4 100 000 $ US |
| 1995 | 334 768 273 $ US | 7 400 000 $ US |
| 1994 | 550 924 374 $ US | −2 800 000 $ US |
| 1993 | 491 466 065 $ US | −2 800 000 $ US |
| 1992 | 422 470 462 $ US | −2 200 000 $ US |
| 1991 | 317 462 141 $ US | −1 800 000 $ US |
| 1990 | 165 122 978 $ US | 8 000 000 $ US |
| 1989 | 167 056 032 $ US | 9 360 000 $ US |
| 1988 | 84 661 628 $ US | 10 100 000 $ US |
| 1987 | 59 574 901 $ US | 4 680 000 $ US |
| 1986 | 549 182 $ US | 4 820 000 $ US |
| 1985 | 19 975 167 $ US | 4 920 000 $ US |
| 1984 | 46 989 197 $ US | 4 460 000 $ US |
| 1983 | 46 123 624 $ US | 8 420 000 $ US |
| 1982 | 79 528 177 $ US | 7 080 000 $ US |
| 1981 | 58 581 336 $ US | 8 340 000 $ US |
| 1980 | 89 416 223 $ US | 13 000 000 $ US |
| 1979 | 7 437 549 $ US | 12 000 000 $ US |
| 1978 | 11 759 988 $ US | 10 000 000 $ US |
| 1977 | 7 994 056 $ US | 8 000 000 $ US |
| 1976 | 38 014 963 $ US | 7 780 000 $ US |
| 1975 | 5 020 000 $ US | 2 640 000 $ US |
| 1974 | −20 400 000 $ US | 7 939 993 $ US |
| 1973 | 5 490 000 $ US | 6 980 000 $ US |
| 1972 | 13 000 000 $ US | 4 059 985 $ US |
| 1971 | 23 100 000 $ US | 3 400 000 $ US |
| 1970 | 20 000 000 $ US | 2 800 000 $ US |
En 2025, les entrées nettes d'investissements directs étrangers étaient de 3,32 milliards de dollars au Maroc et de 12,2 millions de dollars en Haïti : 270 fois plus au Maroc. En 1970, elles étaient de 20 millions de dollars au Maroc et de 2,8 millions de dollars en Haïti.
Les entrées nettes d'investissements directs étrangers au Maroc ont été supérieures à celles d'Haïti pendant 51 des 56 années de 1970 à 2025, et inférieures pendant 5.
Maroc vs Haïti : dernières entrées et sorties d'investissements étrangers
|
Maroc
|
Haïti
|
|
|---|---|---|
| Entrées nettes | +3,32 Md $US | +12,2 M $US |
| Entrées nettes, % du PIB | +1,8 % | +0,0 % |
| Sorties nettes | +812 M $US (2025) | n.d. |
| Entrées nettes, total 2016–2025 | +22,2 Md $US | +831 M $US |
| Rang mondial | 56/192 | 166/192 |
Comparer les investissements directs étrangers de 2 pays au choix
Sources :
- Banque mondiale | Secteur financier (1970–2025, mis à jour en octobre 2026)
Creative Commons Attribution (CC BY) : vous pouvez copier, partager, adapter et réutiliser ce contenu, y compris à des fins commerciales, à condition de citer statistics.wiki et d’indiquer les modifications apportées. Les sources citées ci-dessus peuvent avoir leurs propres conditions de licence.