
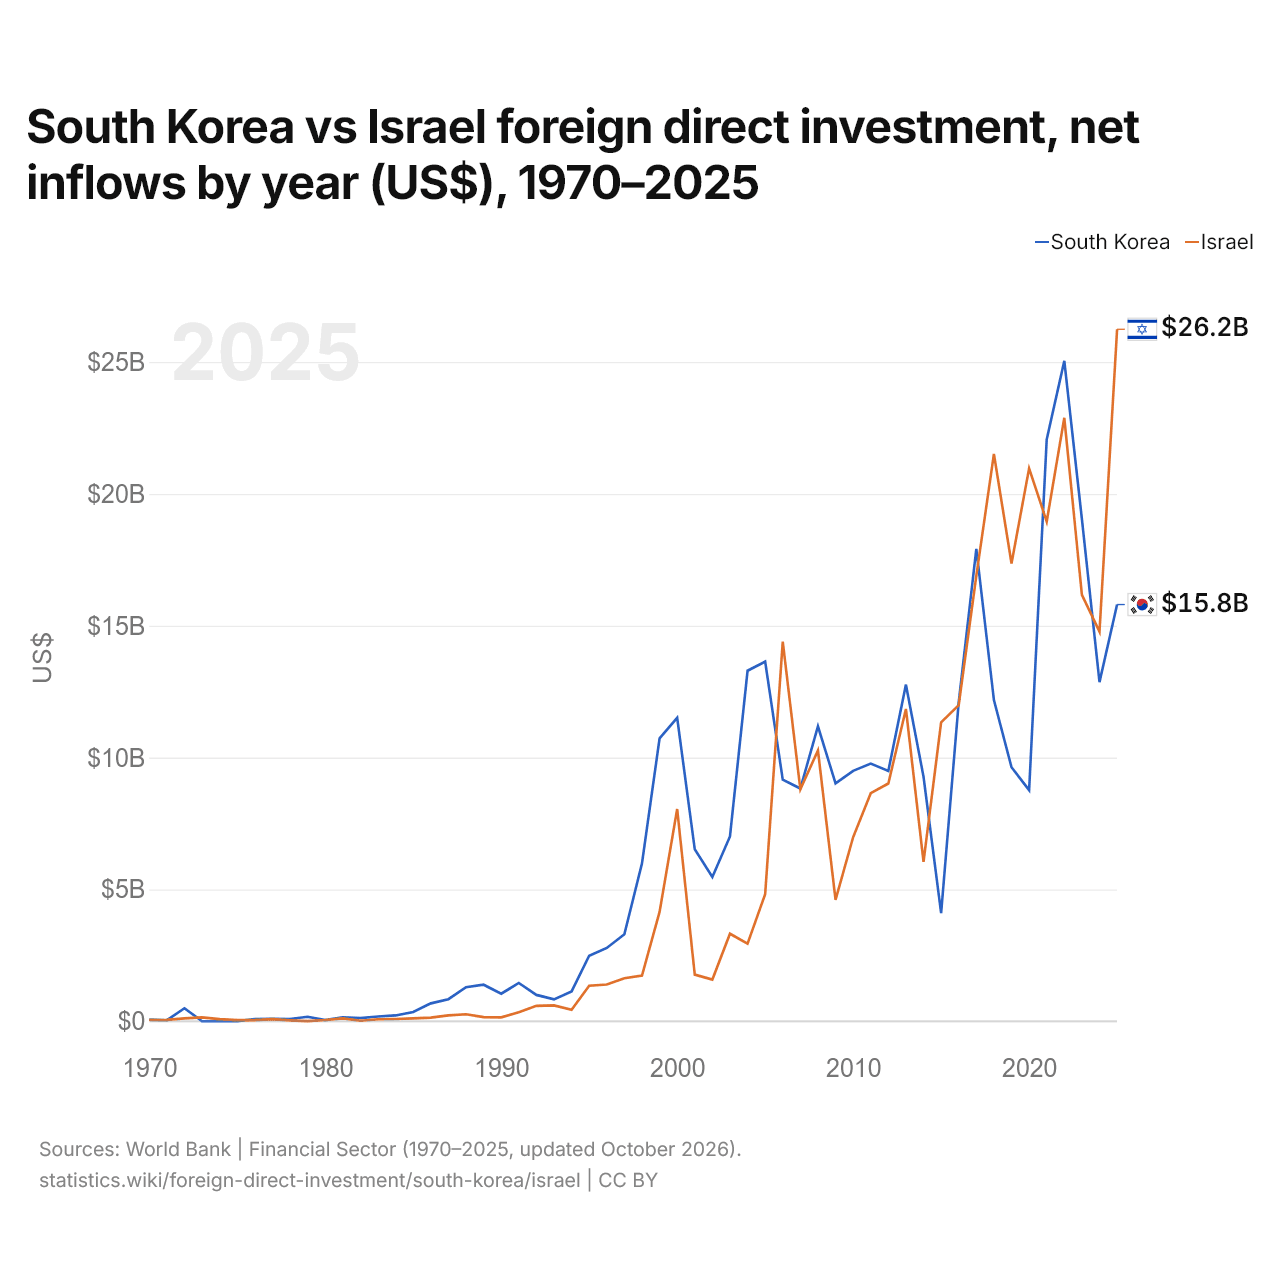
Corée du Sud vs Israël : investissements directs étrangers, entrées nettes par année ($ US), 1970–2025
| Année | $ US | |
|---|---|---|
 Corée du Sud |
 Israël |
|
| 2025 | 15 804 100 000 $ US | 26 242 100 000 $ US |
| 2024 | 12 862 500 000 $ US | 14 777 900 000 $ US |
| 2023 | 19 042 300 000 $ US | 16 170 300 000 $ US |
| 2022 | 25 044 700 000 $ US | 22 883 500 000 $ US |
| 2021 | 22 060 400 000 $ US | 18 949 900 000 $ US |
| 2020 | 8 764 900 000 $ US | 20 968 700 000 $ US |
| 2019 | 9 634 300 000 $ US | 17 362 500 000 $ US |
| 2018 | 12 182 600 000 $ US | 21 514 500 000 $ US |
| 2017 | 17 912 900 000 $ US | 16 892 500 000 $ US |
| 2016 | 12 104 300 000 $ US | 11 988 000 000 $ US |
| 2015 | 4 104 100 000 $ US | 11 336 200 000 $ US |
| 2014 | 9 273 600 000 $ US | 6 048 900 000 $ US |
| 2013 | 12 766 600 000 $ US | 11 842 200 000 $ US |
| 2012 | 9 495 900 000 $ US | 9 017 300 000 $ US |
| 2011 | 9 773 000 000 $ US | 8 653 000 000 $ US |
| 2010 | 9 497 400 000 $ US | 6 984 700 000 $ US |
| 2009 | 9 021 900 000 $ US | 4 606 900 000 $ US |
| 2008 | 11 187 500 000 $ US | 10 274 200 000 $ US |
| 2007 | 8 826 900 000 $ US | 8 798 100 000 $ US |
| 2006 | 9 161 900 000 $ US | 14 395 500 000 $ US |
| 2005 | 13 643 200 000 $ US | 4 818 400 000 $ US |
| 2004 | 13 294 400 000 $ US | 2 946 900 000 $ US |
| 2003 | 7 010 000 000 $ US | 3 322 000 000 $ US |
| 2002 | 5 475 100 000 $ US | 1 582 500 000 $ US |
| 2001 | 6 522 300 000 $ US | 1 771 300 000 $ US |
| 2000 | 11 509 400 000 $ US | 8 047 500 000 $ US |
| 1999 | 10 726 300 000 $ US | 4 150 000 000 $ US |
| 1998 | 5 989 200 000 $ US | 1 737 400 000 $ US |
| 1997 | 3 301 100 000 $ US | 1 633 800 000 $ US |
| 1996 | 2 782 600 000 $ US | 1 397 100 000 $ US |
| 1995 | 2 487 100 000 $ US | 1 350 300 000 $ US |
| 1994 | 1 136 600 000 $ US | 441 600 000 $ US |
| 1993 | 832 300 000 $ US | 604 900 000 $ US |
| 1992 | 1 001 600 000 $ US | 588 500 000 $ US |
| 1991 | 1 455 200 000 $ US | 345 600 000 $ US |
| 1990 | 1 045 600 000 $ US | 151 000 000 $ US |
| 1989 | 1 389 600 000 $ US | 160 400 000 $ US |
| 1988 | 1 293 100 000 $ US | 267 200 000 $ US |
| 1987 | 838 600 000 $ US | 224 100 000 $ US |
| 1986 | 682 500 000 $ US | 143 400 000 $ US |
| 1985 | 355 300 000 $ US | 112 300 000 $ US |
| 1984 | 223 300 000 $ US | 89 500 000 $ US |
| 1983 | 184 300 000 $ US | 78 500 000 $ US |
| 1982 | 120 900 000 $ US | 21 300 000 $ US |
| 1981 | 155 100 000 $ US | 114 400 000 $ US |
| 1980 | 47 100 000 $ US | 51 000 000 $ US |
| 1979 | 172 000 000 $ US | 11 000 000 $ US |
| 1978 | 89 000 000 $ US | 39 000 000 $ US |
| 1977 | 94 000 000 $ US | 81 000 000 $ US |
| 1976 | 81 000 000 $ US | 47 000 000 $ US |
| 1975 | 6 000 000 $ US | 45 000 000 $ US |
| 1974 | 2 000 000 $ US | 84 000 000 $ US |
| 1973 | 4 000 000 $ US | 149 000 000 $ US |
| 1972 | 496 000 000 $ US | 114 000 000 $ US |
| 1971 | 42 000 000 $ US | 57 000 000 $ US |
| 1970 | 66 000 000 $ US | 49 000 000 $ US |
En 2025, les entrées nettes d'investissements directs étrangers étaient de 15,8 milliards de dollars en Corée du Sud et de 26,2 milliards de dollars en Israël : 1,7 fois plus en Israël. En 1970, elles étaient de 66 millions de dollars en Corée du Sud et de 49 millions de dollars en Israël.
Les entrées nettes d'investissements directs étrangers en Corée du Sud ont été supérieures à celles d'Israël pendant 44 des 56 années de 1970 à 2025, et inférieures pendant 12.
Corée du Sud vs Israël : dernières entrées et sorties d'investissements étrangers
|
Corée du Sud
|
Israël
|
|
|---|---|---|
| Entrées nettes | +15,8 Md $US | +26,2 Md $US |
| Entrées nettes, % du PIB | +0,8 % | +4,3 % |
| Sorties nettes | +41,2 Md $US | +14,7 Md $US |
| Entrées nettes, total 2016–2025 | +155 Md $US | +188 Md $US |
| Rang mondial | 26/192 | 18/192 |
Comparer les investissements directs étrangers de 2 pays au choix
Sources :
- Banque mondiale | Secteur financier (1970–2025, mis à jour en octobre 2026)
Creative Commons Attribution (CC BY) : vous pouvez copier, partager, adapter et réutiliser ce contenu, y compris à des fins commerciales, à condition de citer statistics.wiki et d’indiquer les modifications apportées. Les sources citées ci-dessus peuvent avoir leurs propres conditions de licence.