
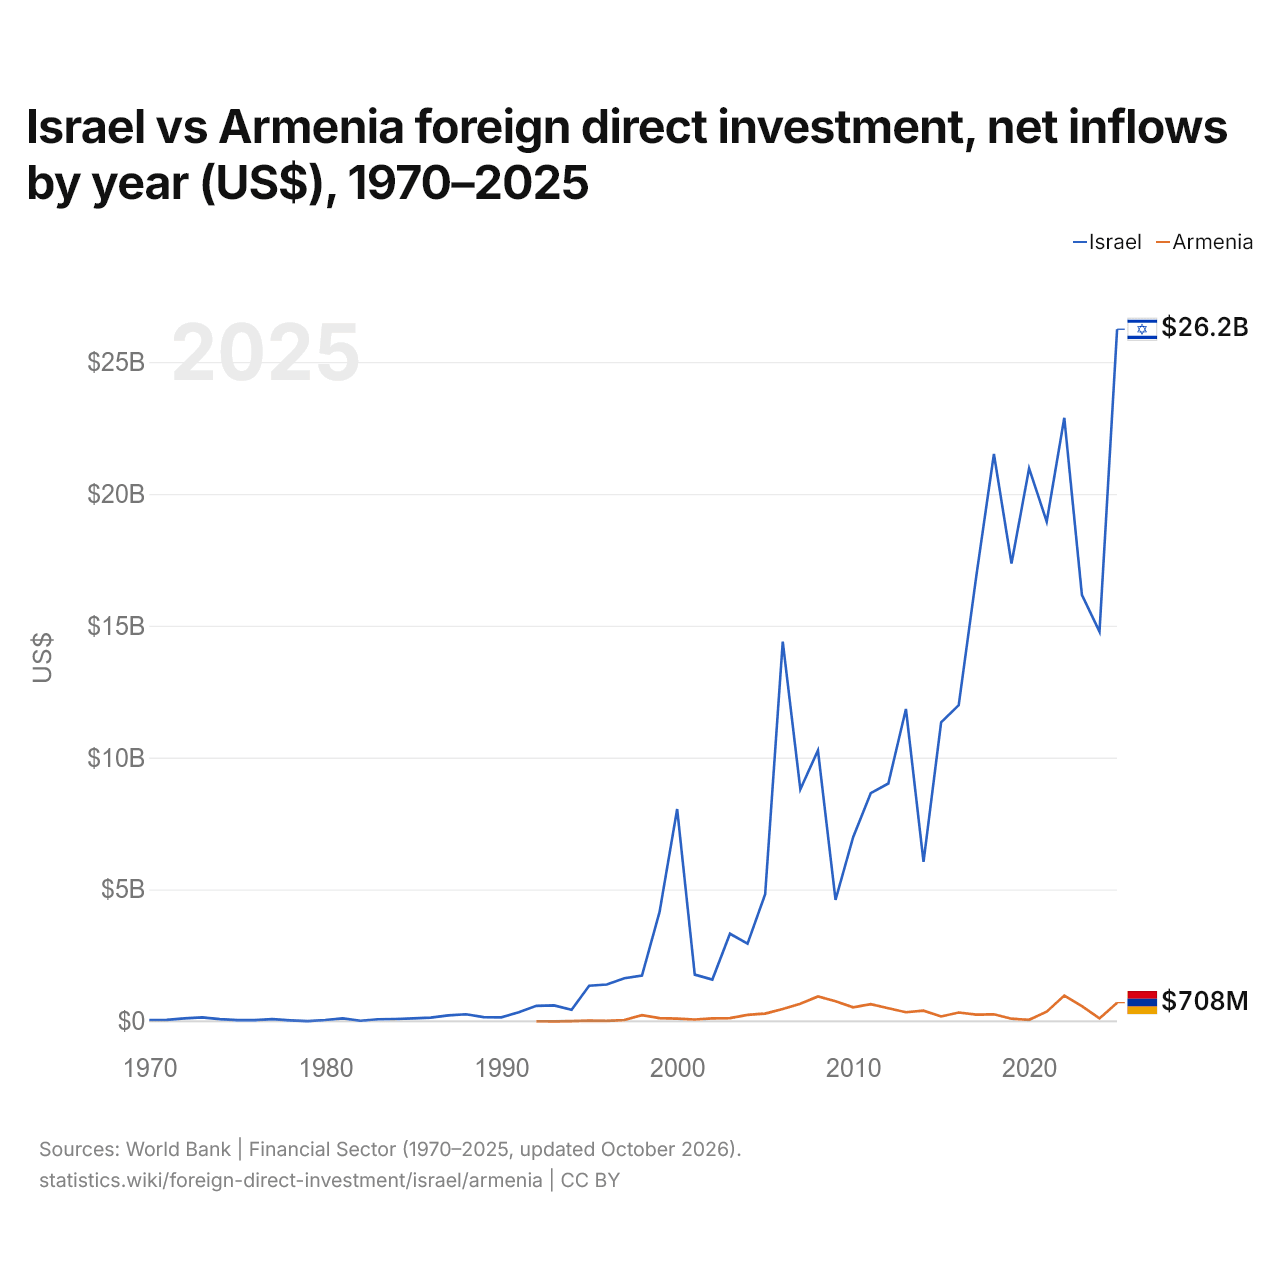
Israël vs Arménie : investissements directs étrangers, entrées nettes par année ($ US), 1970–2025
| Année | $ US | |
|---|---|---|
 Israël |
 Arménie |
|
| 2025 | 26 242 100 000 $ US | 708 031 506 $ US |
| 2024 | 14 777 900 000 $ US | 110 708 390 $ US |
| 2023 | 16 170 300 000 $ US | 580 365 079 $ US |
| 2022 | 22 883 500 000 $ US | 975 658 909 $ US |
| 2021 | 18 949 900 000 $ US | 366 423 011 $ US |
| 2020 | 20 968 700 000 $ US | 58 582 750 $ US |
| 2019 | 17 362 500 000 $ US | 100 285 082 $ US |
| 2018 | 21 514 500 000 $ US | 266 855 049 $ US |
| 2017 | 16 892 500 000 $ US | 252 747 991 $ US |
| 2016 | 11 988 000 000 $ US | 333 823 946 $ US |
| 2015 | 11 336 200 000 $ US | 184 127 986 $ US |
| 2014 | 6 048 900 000 $ US | 406 578 407 $ US |
| 2013 | 11 842 200 000 $ US | 346 092 394 $ US |
| 2012 | 9 017 300 000 $ US | 496 636 701 $ US |
| 2011 | 8 653 000 000 $ US | 653 219 756 $ US |
| 2010 | 6 984 700 000 $ US | 529 321 392 $ US |
| 2009 | 4 606 900 000 $ US | 760 040 746 $ US |
| 2008 | 10 274 200 000 $ US | 943 733 059 $ US |
| 2007 | 8 798 100 000 $ US | 667 671 562 $ US |
| 2006 | 14 395 500 000 $ US | 466 531 992 $ US |
| 2005 | 4 818 400 000 $ US | 292 073 220 $ US |
| 2004 | 2 946 900 000 $ US | 247 140 608 $ US |
| 2003 | 3 322 000 000 $ US | 122 852 993 $ US |
| 2002 | 1 582 500 000 $ US | 110 725 326 $ US |
| 2001 | 1 771 300 000 $ US | 69 868 500 $ US |
| 2000 | 8 047 500 000 $ US | 104 188 500 $ US |
| 1999 | 4 150 000 000 $ US | 122 034 000 $ US |
| 1998 | 1 737 400 000 $ US | 232 375 000 $ US |
| 1997 | 1 633 800 000 $ US | 51 940 000 $ US |
| 1996 | 1 397 100 000 $ US | 17 570 000 $ US |
| 1995 | 1 350 300 000 $ US | 25 320 000 $ US |
| 1994 | 441 600 000 $ US | 8 000 000 $ US |
| 1993 | 604 900 000 $ US | 800 000 $ US |
| 1992 | 588 500 000 $ US | 2 400 000 $ US |
| 1991 | 345 600 000 $ US | - |
| 1990 | 151 000 000 $ US | - |
| 1989 | 160 400 000 $ US | - |
| 1988 | 267 200 000 $ US | - |
| 1987 | 224 100 000 $ US | - |
| 1986 | 143 400 000 $ US | - |
| 1985 | 112 300 000 $ US | - |
| 1984 | 89 500 000 $ US | - |
| 1983 | 78 500 000 $ US | - |
| 1982 | 21 300 000 $ US | - |
| 1981 | 114 400 000 $ US | - |
| 1980 | 51 000 000 $ US | - |
| 1979 | 11 000 000 $ US | - |
| 1978 | 39 000 000 $ US | - |
| 1977 | 81 000 000 $ US | - |
| 1976 | 47 000 000 $ US | - |
| 1975 | 45 000 000 $ US | - |
| 1974 | 84 000 000 $ US | - |
| 1973 | 149 000 000 $ US | - |
| 1972 | 114 000 000 $ US | - |
| 1971 | 57 000 000 $ US | - |
| 1970 | 49 000 000 $ US | - |
En 2025, les entrées nettes d'investissements directs étrangers étaient de 26,2 milliards de dollars en Israël et de 708 millions de dollars en Arménie : 37 fois plus en Israël. En 1992, elles étaient de 589 millions de dollars en Israël et de 2,4 millions de dollars en Arménie.
Les entrées nettes d'investissements directs étrangers en Israël ont été supérieures à celles de l'Arménie chacune des 34 années de 1992 à 2025.
Israël vs Arménie : dernières entrées et sorties d'investissements étrangers
|
Israël
|
Arménie
|
|
|---|---|---|
| Entrées nettes | +26,2 Md $US | +708 M $US |
| Entrées nettes, % du PIB | +4,3 % | +2,4 % |
| Sorties nettes | +14,7 Md $US | +74,0 M $US |
| Entrées nettes, total 2016–2025 | +188 Md $US | +3,75 Md $US |
| Rang mondial | 18/192 | 106/192 |
Comparer les investissements directs étrangers de 2 pays au choix
Sources :
- Banque mondiale | Secteur financier (1970–2025, mis à jour en octobre 2026)
Creative Commons Attribution (CC BY) : vous pouvez copier, partager, adapter et réutiliser ce contenu, y compris à des fins commerciales, à condition de citer statistics.wiki et d’indiquer les modifications apportées. Les sources citées ci-dessus peuvent avoir leurs propres conditions de licence.