
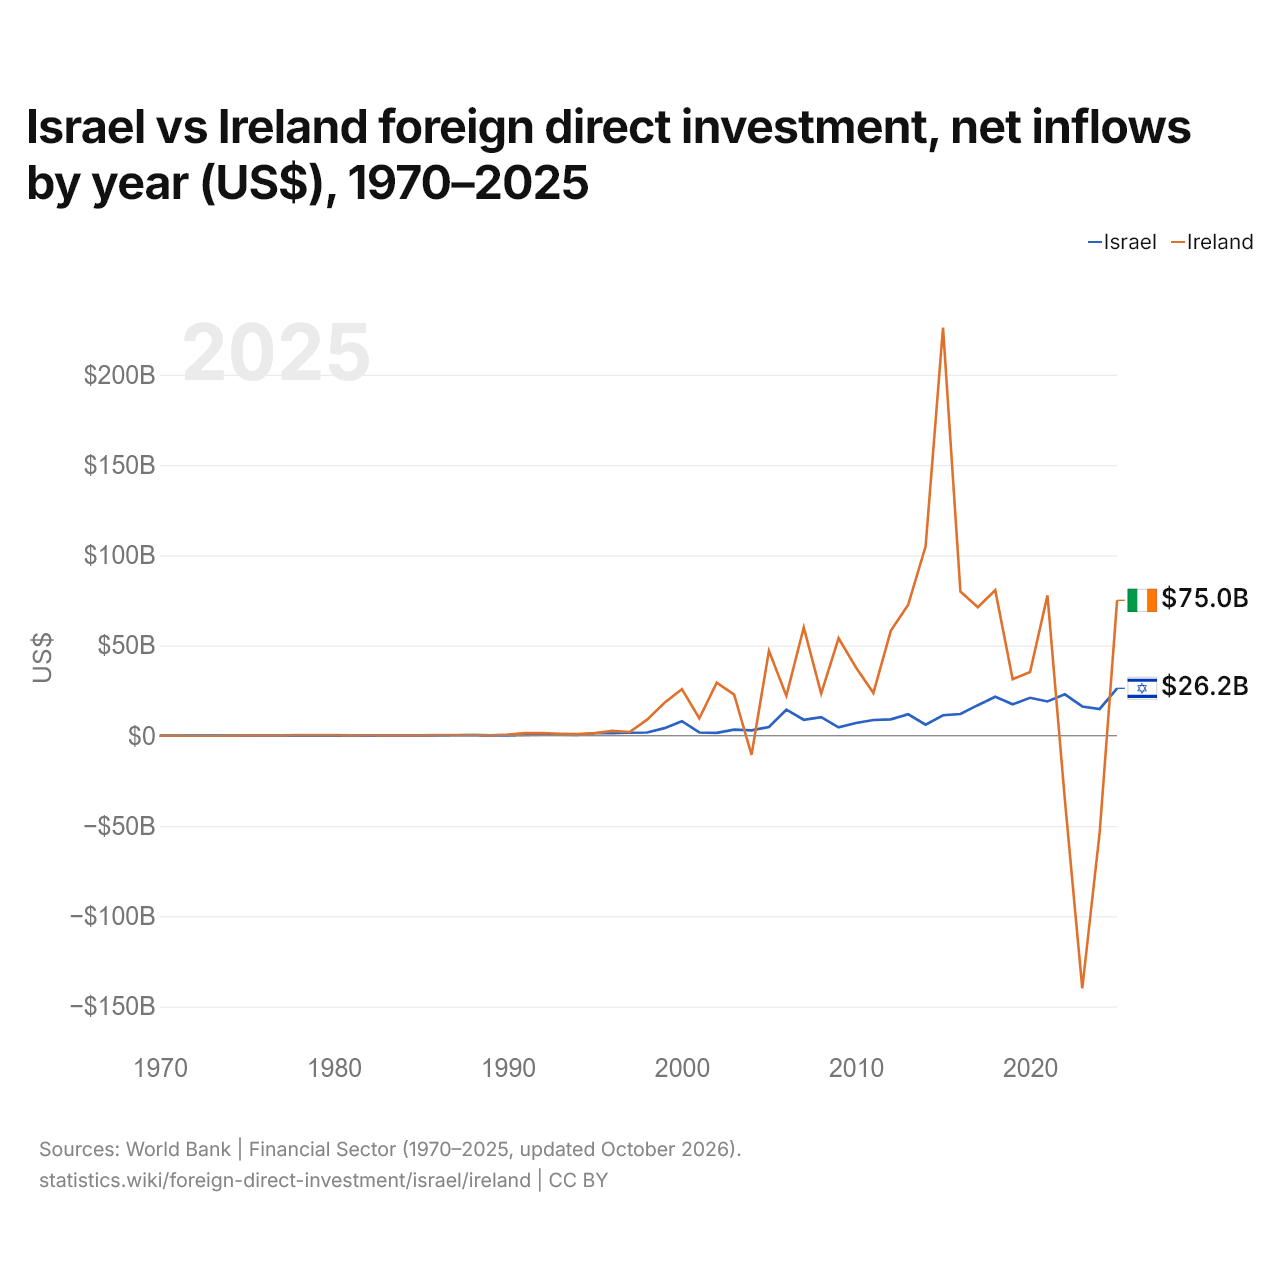
Israël vs Irlande : investissements directs étrangers, entrées nettes par année ($ US), 1970–2025
| Année | $ US | |
|---|---|---|
 Israël |
 Irlande |
|
| 2025 | 26 242 100 000 $ US | 74 999 719 124 $ US |
| 2024 | 14 777 900 000 $ US | −53 563 388 768 $ US |
| 2023 | 16 170 300 000 $ US | −139 972 323 560 $ US |
| 2022 | 22 883 500 000 $ US | −35 575 910 808 $ US |
| 2021 | 18 949 900 000 $ US | 77 722 796 051 $ US |
| 2020 | 20 968 700 000 $ US | 35 288 206 770 $ US |
| 2019 | 17 362 500 000 $ US | 31 252 184 929 $ US |
| 2018 | 21 514 500 000 $ US | 80 581 468 517 $ US |
| 2017 | 16 892 500 000 $ US | 71 124 020 352 $ US |
| 2016 | 11 988 000 000 $ US | 79 795 011 378 $ US |
| 2015 | 11 336 200 000 $ US | 226 022 972 770 $ US |
| 2014 | 6 048 900 000 $ US | 104 903 896 348 $ US |
| 2013 | 11 842 200 000 $ US | 72 540 330 764 $ US |
| 2012 | 9 017 300 000 $ US | 58 090 414 123 $ US |
| 2011 | 8 653 000 000 $ US | 23 699 352 433 $ US |
| 2010 | 6 984 700 000 $ US | 37 748 455 284 $ US |
| 2009 | 4 606 900 000 $ US | 53 974 309 647 $ US |
| 2008 | 10 274 200 000 $ US | 23 287 686 336 $ US |
| 2007 | 8 798 100 000 $ US | 59 934 755 383 $ US |
| 2006 | 14 395 500 000 $ US | 22 070 063 905 $ US |
| 2005 | 4 818 400 000 $ US | 47 001 243 614 $ US |
| 2004 | 2 946 900 000 $ US | −10 607 612 697 $ US |
| 2003 | 3 322 000 000 $ US | 22 781 292 817 $ US |
| 2002 | 1 582 500 000 $ US | 29 323 796 527 $ US |
| 2001 | 1 771 300 000 $ US | 9 650 920 350 $ US |
| 2000 | 8 047 500 000 $ US | 25 779 436 153 $ US |
| 1999 | 4 150 000 000 $ US | 18 210 641 714 $ US |
| 1998 | 1 737 400 000 $ US | 8 862 216 911 $ US |
| 1997 | 1 633 800 000 $ US | 2 028 797 815 $ US |
| 1996 | 1 397 100 000 $ US | 2 617 483 000 $ US |
| 1995 | 1 350 300 000 $ US | 1 442 925 000 $ US |
| 1994 | 441 600 000 $ US | 856 979 000 $ US |
| 1993 | 604 900 000 $ US | 1 077 890 000 $ US |
| 1992 | 588 500 000 $ US | 1 458 175 000 $ US |
| 1991 | 345 600 000 $ US | 1 361 668 000 $ US |
| 1990 | 151 000 000 $ US | 621 911 000 $ US |
| 1989 | 160 400 000 $ US | 192 759 336 $ US |
| 1988 | 267 200 000 $ US | 257 438 683 $ US |
| 1987 | 224 100 000 $ US | 322 476 620 $ US |
| 1986 | 143 400 000 $ US | 250 293 355 $ US |
| 1985 | 112 300 000 $ US | 163 660 000 $ US |
| 1984 | 89 500 000 $ US | 121 360 000 $ US |
| 1983 | 78 500 000 $ US | 169 650 000 $ US |
| 1982 | 21 300 000 $ US | 242 010 000 $ US |
| 1981 | 114 400 000 $ US | 203 450 000 $ US |
| 1980 | 51 000 000 $ US | 286 450 000 $ US |
| 1979 | 11 000 000 $ US | 336 680 000 $ US |
| 1978 | 39 000 000 $ US | 375 260 000 $ US |
| 1977 | 81 000 000 $ US | 136 240 000 $ US |
| 1976 | 47 000 000 $ US | 172 680 000 $ US |
| 1975 | 45 000 000 $ US | 158 170 000 $ US |
| 1974 | 84 000 000 $ US | 51 200 000 $ US |
| 1973 | 149 000 000 $ US | 52 000 000 $ US |
| 1972 | 114 000 000 $ US | 31 000 000 $ US |
| 1971 | 57 000 000 $ US | 25 000 000 $ US |
| 1970 | 49 000 000 $ US | 32 000 000 $ US |
En 2025, les entrées nettes d'investissements directs étrangers étaient de 26,2 milliards de dollars en Israël et de 75 milliards de dollars en Irlande : 2,9 fois plus en Irlande. En 1970, elles étaient de 49 millions de dollars en Israël et de 32 millions de dollars en Irlande.
Les entrées nettes d'investissements directs étrangers en Israël ont été supérieures à celles de l'Irlande pendant 10 des 56 années de 1970 à 2025, et inférieures pendant 46.
Israël vs Irlande : dernières entrées et sorties d'investissements étrangers
|
Israël
|
Irlande
|
|
|---|---|---|
| Entrées nettes | +26,2 Md $US | +75,0 Md $US |
| Entrées nettes, % du PIB | +4,3 % | +10,4 % |
| Sorties nettes | +14,7 Md $US | +86,4 Md $US |
| Entrées nettes, total 2016–2025 | +188 Md $US | +222 Md $US |
| Rang mondial | 18/192 | 6/192 |
Comparer les investissements directs étrangers de 2 pays au choix
Sources :
- Banque mondiale | Secteur financier (1970–2025, mis à jour en octobre 2026)
Creative Commons Attribution (CC BY) : vous pouvez copier, partager, adapter et réutiliser ce contenu, y compris à des fins commerciales, à condition de citer statistics.wiki et d’indiquer les modifications apportées. Les sources citées ci-dessus peuvent avoir leurs propres conditions de licence.