
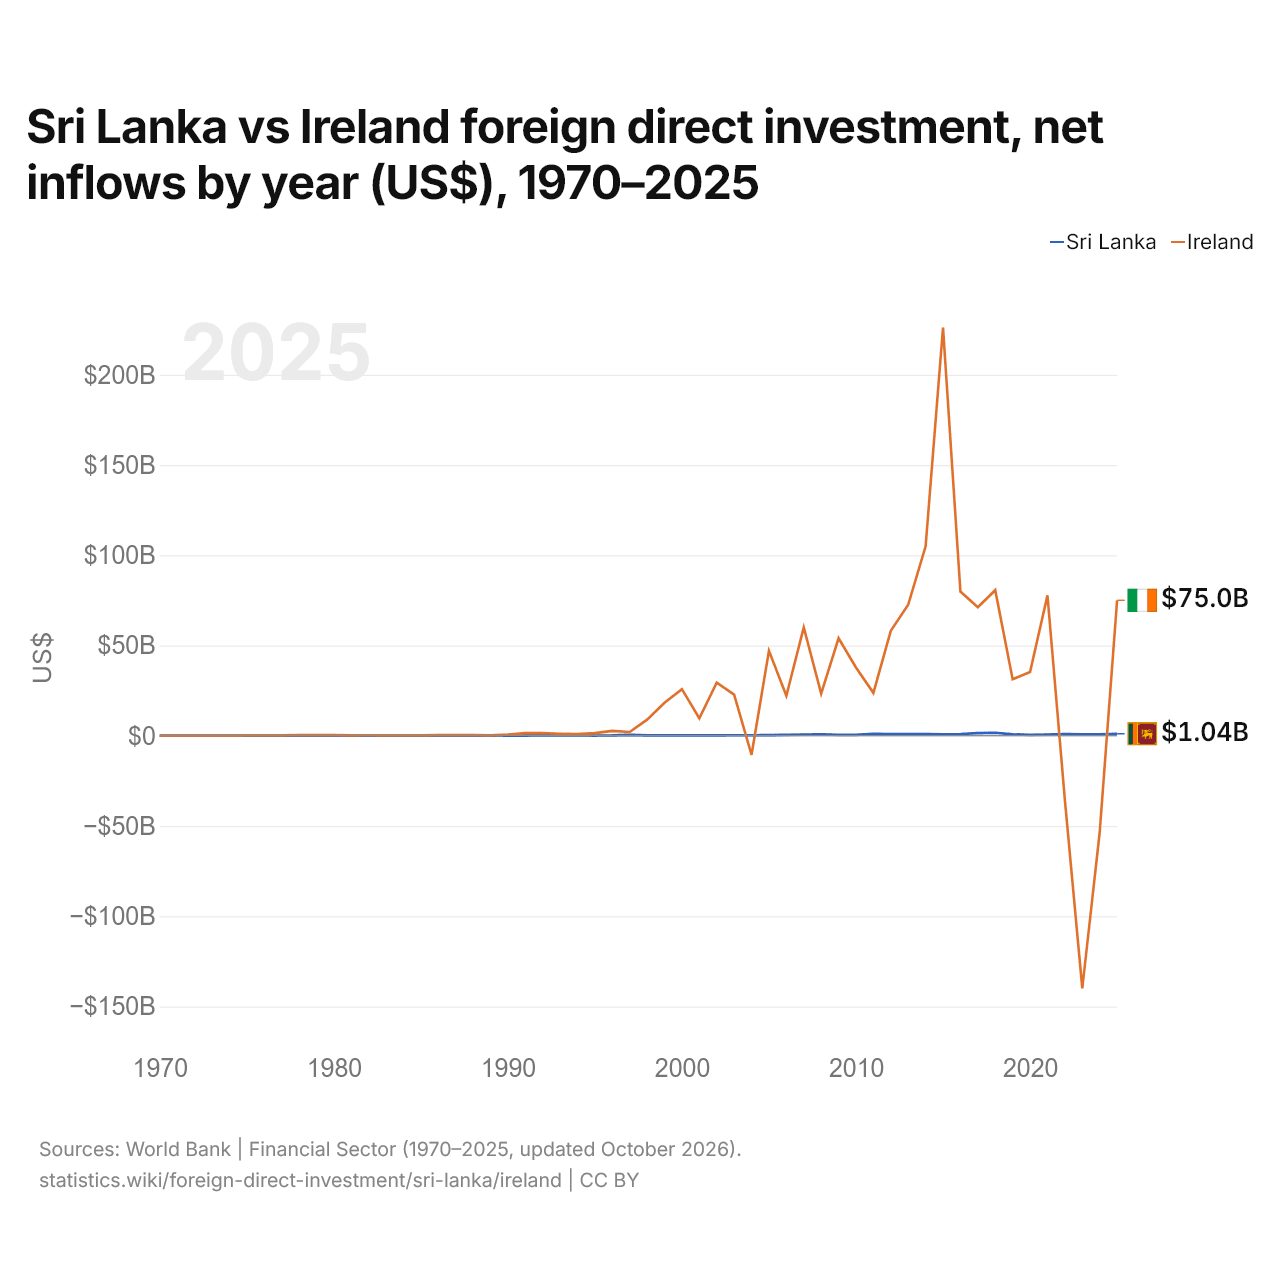
Sri Lanka vs Irlande : investissements directs étrangers, entrées nettes par année ($ US), 1970–2025
| Année | $ US | |
|---|---|---|
 Sri Lanka |
 Irlande |
|
| 2025 | 1 043 936 118 $ US | 74 999 719 124 $ US |
| 2024 | 759 240 352 $ US | −53 563 388 768 $ US |
| 2023 | 713 015 365 $ US | −139 972 323 560 $ US |
| 2022 | 884 150 491 $ US | −35 575 910 808 $ US |
| 2021 | 592 289 970 $ US | 77 722 796 051 $ US |
| 2020 | 434 075 668 $ US | 35 288 206 770 $ US |
| 2019 | 743 466 231 $ US | 31 252 184 929 $ US |
| 2018 | 1 614 044 009 $ US | 80 581 468 517 $ US |
| 2017 | 1 372 723 043 $ US | 71 124 020 352 $ US |
| 2016 | 897 049 376 $ US | 79 795 011 378 $ US |
| 2015 | 679 655 644 $ US | 226 022 972 770 $ US |
| 2014 | 893 628 980 $ US | 104 903 896 348 $ US |
| 2013 | 932 551 318 $ US | 72 540 330 764 $ US |
| 2012 | 941 116 591 $ US | 58 090 414 123 $ US |
| 2011 | 955 920 000 $ US | 23 699 352 433 $ US |
| 2010 | 477 559 000 $ US | 37 748 455 284 $ US |
| 2009 | 404 000 000 $ US | 53 974 309 647 $ US |
| 2008 | 752 200 000 $ US | 23 287 686 336 $ US |
| 2007 | 603 000 000 $ US | 59 934 755 383 $ US |
| 2006 | 479 700 000 $ US | 22 070 063 905 $ US |
| 2005 | 272 400 000 $ US | 47 001 243 614 $ US |
| 2004 | 232 800 000 $ US | −10 607 612 697 $ US |
| 2003 | 228 720 000 $ US | 22 781 292 817 $ US |
| 2002 | 196 500 000 $ US | 29 323 796 527 $ US |
| 2001 | 171 790 000 $ US | 9 650 920 350 $ US |
| 2000 | 172 941 410 $ US | 25 779 436 153 $ US |
| 1999 | 176 410 171 $ US | 18 210 641 714 $ US |
| 1998 | 193 424 023 $ US | 8 862 216 911 $ US |
| 1997 | 430 056 152 $ US | 2 028 797 815 $ US |
| 1996 | 119 874 350 $ US | 2 617 483 000 $ US |
| 1995 | 55 995 588 $ US | 1 442 925 000 $ US |
| 1994 | 166 412 940 $ US | 856 979 000 $ US |
| 1993 | 194 479 070 $ US | 1 077 890 000 $ US |
| 1992 | 122 625 843 $ US | 1 458 175 000 $ US |
| 1991 | 48 349 174 $ US | 1 361 668 000 $ US |
| 1990 | 43 355 120 $ US | 621 911 000 $ US |
| 1989 | 19 741 313 $ US | 192 759 336 $ US |
| 1988 | 45 722 529 $ US | 257 438 683 $ US |
| 1987 | 59 504 202 $ US | 322 476 620 $ US |
| 1986 | 29 723 120 $ US | 250 293 355 $ US |
| 1985 | 26 162 080 $ US | 163 660 000 $ US |
| 1984 | 32 612 391 $ US | 121 360 000 $ US |
| 1983 | 37 778 898 $ US | 169 650 000 $ US |
| 1982 | 63 567 609 $ US | 242 010 000 $ US |
| 1981 | 49 264 554 $ US | 203 450 000 $ US |
| 1980 | 43 010 507 $ US | 286 450 000 $ US |
| 1979 | 46 911 742 $ US | 336 680 000 $ US |
| 1978 | 1 474 392 $ US | 375 260 000 $ US |
| 1977 | −1 218 567 $ US | 136 240 000 $ US |
| 1976 | 1 000 $ US | 172 680 000 $ US |
| 1975 | 142 711 $ US | 158 170 000 $ US |
| 1974 | 1 400 000 $ US | 51 200 000 $ US |
| 1973 | 500 000 $ US | 52 000 000 $ US |
| 1972 | 300 000 $ US | 31 000 000 $ US |
| 1971 | 300 000 $ US | 25 000 000 $ US |
| 1970 | −300 000 $ US | 32 000 000 $ US |
En 2025, les entrées nettes d'investissements directs étrangers étaient de 1,04 milliard de dollars au Sri Lanka et de 75 milliards de dollars en Irlande : 72 fois plus en Irlande. En 1970, elles étaient négatives au Sri Lanka, 300 000 dollars et de 32 millions de dollars en Irlande.
Les entrées nettes d'investissements directs étrangers au Sri Lanka ont été supérieures à celles de l'Irlande pendant 4 des 56 années de 1970 à 2025, et inférieures pendant 52.
Sri Lanka vs Irlande : dernières entrées et sorties d'investissements étrangers
|
Sri Lanka
|
Irlande
|
|
|---|---|---|
| Entrées nettes | +1,04 Md $US | +75,0 Md $US |
| Entrées nettes, % du PIB | +1,0 % | +10,4 % |
| Sorties nettes | +98,2 M $US | +86,4 Md $US |
| Entrées nettes, total 2016–2025 | +9,05 Md $US | +222 Md $US |
| Rang mondial | 92/192 | 6/192 |
Comparer les investissements directs étrangers de 2 pays au choix
Sources :
- Banque mondiale | Secteur financier (1970–2025, mis à jour en octobre 2026)
Creative Commons Attribution (CC BY) : vous pouvez copier, partager, adapter et réutiliser ce contenu, y compris à des fins commerciales, à condition de citer statistics.wiki et d’indiquer les modifications apportées. Les sources citées ci-dessus peuvent avoir leurs propres conditions de licence.