
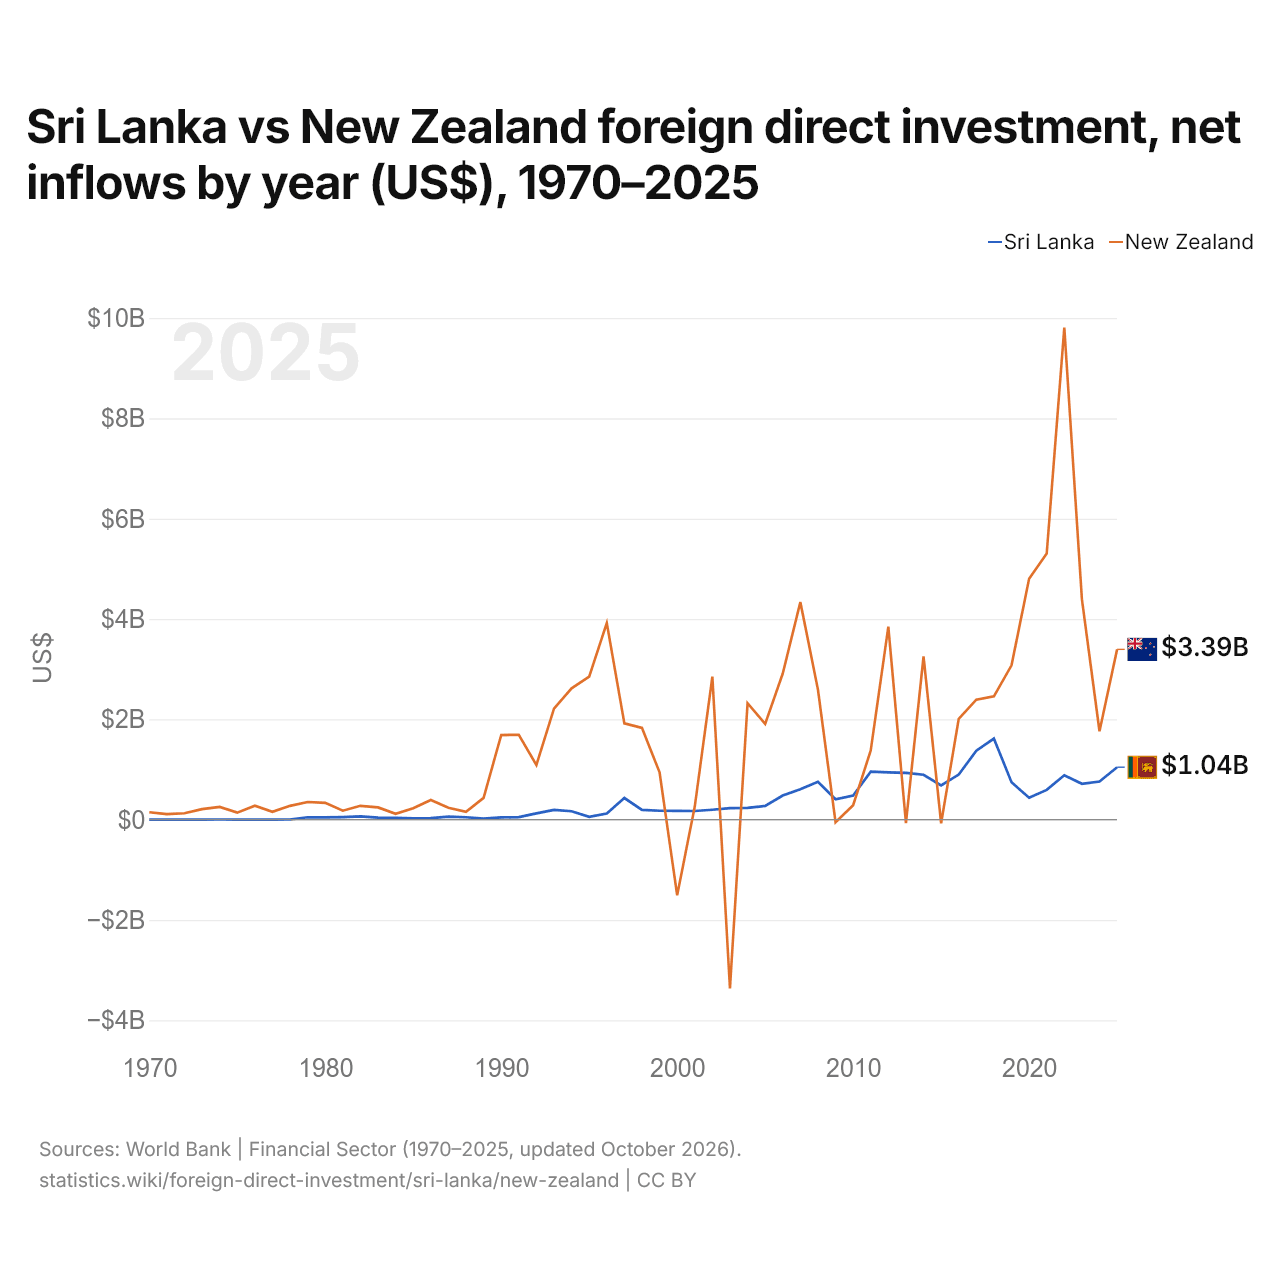
Sri Lanka vs Nouvelle-Zélande : investissements directs étrangers, entrées nettes par année ($ US), 1970–2025
| Année | $ US | |
|---|---|---|
 Sri Lanka |
 Nouvelle-Zélande |
|
| 2025 | 1 043 936 118 $ US | 3 393 445 046 $ US |
| 2024 | 759 240 352 $ US | 1 759 833 655 $ US |
| 2023 | 713 015 365 $ US | 4 394 895 399 $ US |
| 2022 | 884 150 491 $ US | 9 806 744 153 $ US |
| 2021 | 592 289 970 $ US | 5 304 581 495 $ US |
| 2020 | 434 075 668 $ US | 4 800 458 072 $ US |
| 2019 | 743 466 231 $ US | 3 074 896 212 $ US |
| 2018 | 1 614 044 009 $ US | 2 456 550 920 $ US |
| 2017 | 1 372 723 043 $ US | 2 390 035 935 $ US |
| 2016 | 897 049 376 $ US | 2 008 111 275 $ US |
| 2015 | 679 655 644 $ US | −73 372 796 $ US |
| 2014 | 893 628 980 $ US | 3 251 563 602 $ US |
| 2013 | 932 551 318 $ US | −69 519 935 $ US |
| 2012 | 941 116 591 $ US | 3 846 884 019 $ US |
| 2011 | 955 920 000 $ US | 1 378 410 924 $ US |
| 2010 | 477 559 000 $ US | 286 306 903 $ US |
| 2009 | 404 000 000 $ US | −52 385 533 $ US |
| 2008 | 752 200 000 $ US | 2 591 966 537 $ US |
| 2007 | 603 000 000 $ US | 4 335 506 076 $ US |
| 2006 | 479 700 000 $ US | 2 912 645 687 $ US |
| 2005 | 272 400 000 $ US | 1 906 665 964 $ US |
| 2004 | 232 800 000 $ US | 2 319 819 298 $ US |
| 2003 | 228 720 000 $ US | −3 363 941 288 $ US |
| 2002 | 196 500 000 $ US | 2 848 556 987 $ US |
| 2001 | 171 790 000 $ US | 259 321 577 $ US |
| 2000 | 172 941 410 $ US | −1 507 812 033 $ US |
| 1999 | 176 410 171 $ US | 941 464 112 $ US |
| 1998 | 193 424 023 $ US | 1 825 772 782 $ US |
| 1997 | 430 056 152 $ US | 1 917 456 791 $ US |
| 1996 | 119 874 350 $ US | 3 918 617 040 $ US |
| 1995 | 55 995 588 $ US | 2 849 961 939 $ US |
| 1994 | 166 412 940 $ US | 2 616 630 695 $ US |
| 1993 | 194 479 070 $ US | 2 211 822 687 $ US |
| 1992 | 122 625 843 $ US | 1 088 200 066 $ US |
| 1991 | 48 349 174 $ US | 1 691 366 072 $ US |
| 1990 | 43 355 120 $ US | 1 684 763 155 $ US |
| 1989 | 19 741 313 $ US | 433 573 543 $ US |
| 1988 | 45 722 529 $ US | 155 922 432 $ US |
| 1987 | 59 504 202 $ US | 237 229 723 $ US |
| 1986 | 29 723 120 $ US | 389 408 100 $ US |
| 1985 | 26 162 080 $ US | 225 366 591 $ US |
| 1984 | 32 612 391 $ US | 116 213 811 $ US |
| 1983 | 37 778 898 $ US | 243 190 337 $ US |
| 1982 | 63 567 609 $ US | 274 648 997 $ US |
| 1981 | 49 264 554 $ US | 176 961 979 $ US |
| 1980 | 43 010 507 $ US | 334 086 570 $ US |
| 1979 | 46 911 742 $ US | 350 540 000 $ US |
| 1978 | 1 474 392 $ US | 273 740 000 $ US |
| 1977 | −1 218 567 $ US | 154 320 000 $ US |
| 1976 | 1 000 $ US | 277 640 000 $ US |
| 1975 | 142 711 $ US | 138 170 000 $ US |
| 1974 | 1 400 000 $ US | 251 610 000 $ US |
| 1973 | 500 000 $ US | 207 650 000 $ US |
| 1972 | 300 000 $ US | 126 690 000 $ US |
| 1971 | 300 000 $ US | 110 000 000 $ US |
| 1970 | −300 000 $ US | 146 000 000 $ US |
En 2025, les entrées nettes d'investissements directs étrangers étaient de 1,04 milliard de dollars au Sri Lanka et de 3,39 milliards de dollars en Nouvelle-Zélande : 3,3 fois plus en Nouvelle-Zélande. En 1970, elles étaient négatives au Sri Lanka, 300 000 dollars et de 146 millions de dollars en Nouvelle-Zélande.
Les entrées nettes d'investissements directs étrangers au Sri Lanka ont été supérieures à celles de la Nouvelle-Zélande pendant 6 des 56 années de 1970 à 2025, et inférieures pendant 50.
Sri Lanka vs Nouvelle-Zélande : dernières entrées et sorties d'investissements étrangers
|
Sri Lanka
|
Nouvelle-Zélande
|
|
|---|---|---|
| Entrées nettes | +1,04 Md $US | +3,39 Md $US |
| Entrées nettes, % du PIB | +1,0 % | +1,3 % |
| Sorties nettes | +98,2 M $US | +43,9 M $US |
| Entrées nettes, total 2016–2025 | +9,05 Md $US | +39,4 Md $US |
| Rang mondial | 92/192 | 54/192 |
Comparer les investissements directs étrangers de 2 pays au choix
Sources :
- Banque mondiale | Secteur financier (1970–2025, mis à jour en octobre 2026)
Creative Commons Attribution (CC BY) : vous pouvez copier, partager, adapter et réutiliser ce contenu, y compris à des fins commerciales, à condition de citer statistics.wiki et d’indiquer les modifications apportées. Les sources citées ci-dessus peuvent avoir leurs propres conditions de licence.