
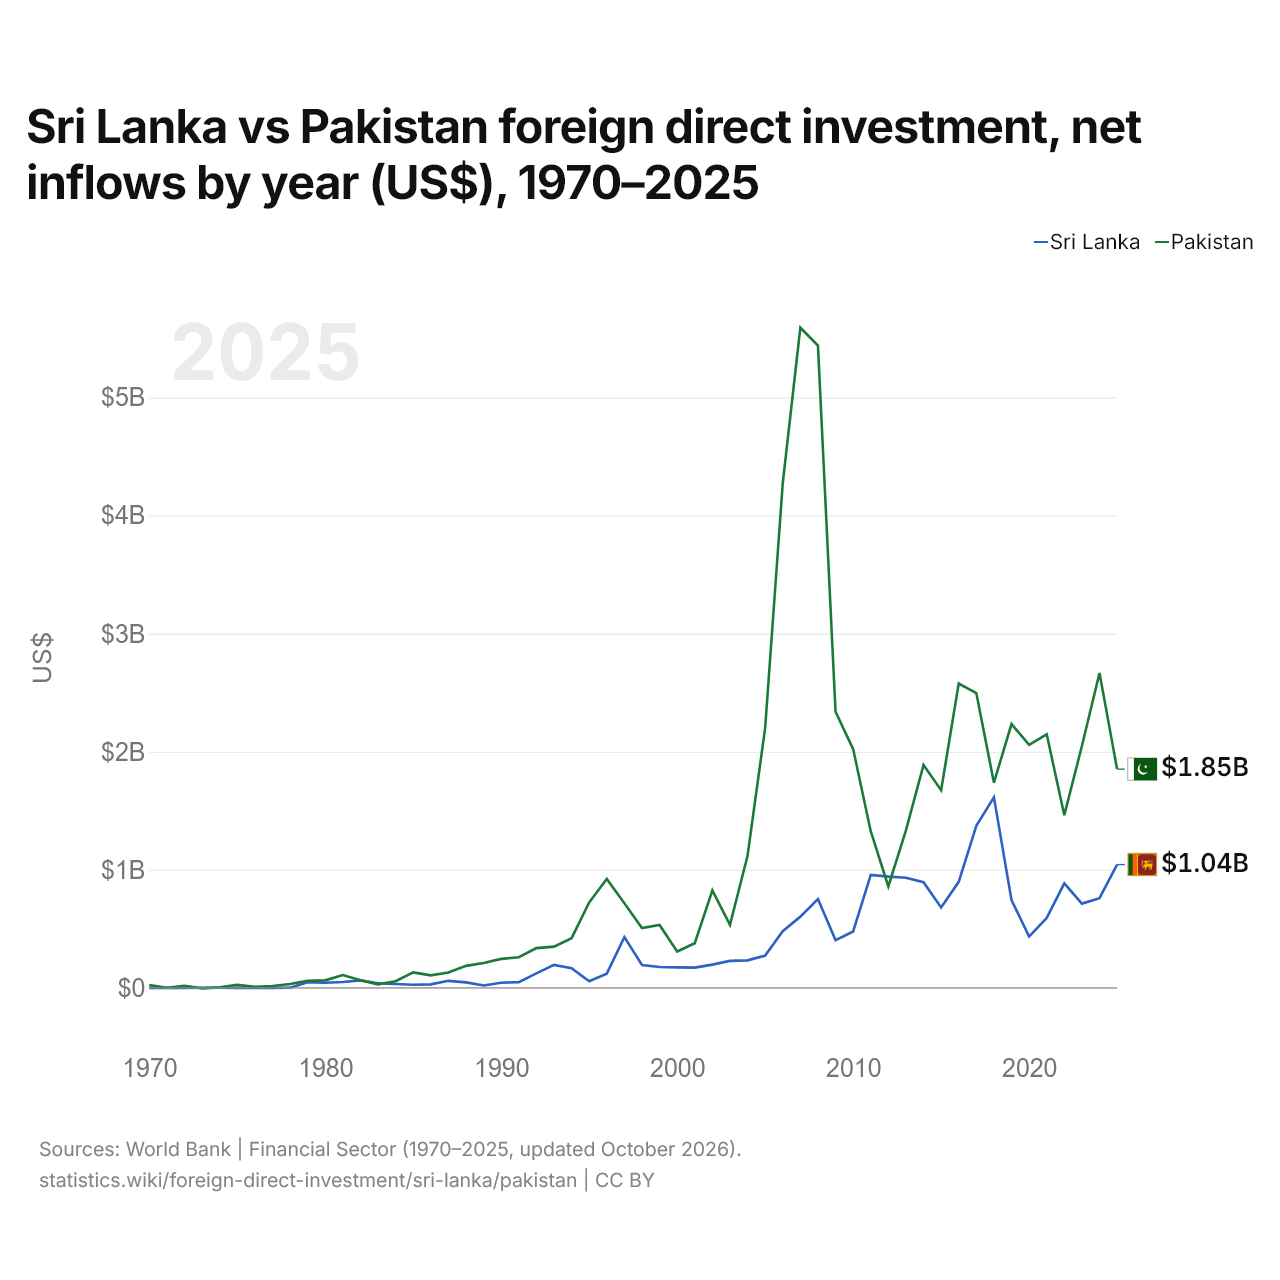
Sri Lanka vs Pakistan : investissements directs étrangers, entrées nettes par année ($ US), 1970–2025
| Année | $ US | |
|---|---|---|
 Sri Lanka |
 Pakistan |
|
| 2025 | 1 043 936 118 $ US | 1 852 000 000 $ US |
| 2024 | 759 240 352 $ US | 2 665 000 000 $ US |
| 2023 | 713 015 365 $ US | 2 048 000 000 $ US |
| 2022 | 884 150 491 $ US | 1 462 000 000 $ US |
| 2021 | 592 289 970 $ US | 2 147 000 000 $ US |
| 2020 | 434 075 668 $ US | 2 057 000 000 $ US |
| 2019 | 743 466 231 $ US | 2 234 000 000 $ US |
| 2018 | 1 614 044 009 $ US | 1 737 000 000 $ US |
| 2017 | 1 372 723 043 $ US | 2 496 000 000 $ US |
| 2016 | 897 049 376 $ US | 2 576 000 000 $ US |
| 2015 | 679 655 644 $ US | 1 673 000 000 $ US |
| 2014 | 893 628 980 $ US | 1 887 000 000 $ US |
| 2013 | 932 551 318 $ US | 1 333 000 000 $ US |
| 2012 | 941 116 591 $ US | 859 000 000 $ US |
| 2011 | 955 920 000 $ US | 1 326 000 000 $ US |
| 2010 | 477 559 000 $ US | 2 022 000 000 $ US |
| 2009 | 404 000 000 $ US | 2 338 000 000 $ US |
| 2008 | 752 200 000 $ US | 5 438 000 000 $ US |
| 2007 | 603 000 000 $ US | 5 590 000 000 $ US |
| 2006 | 479 700 000 $ US | 4 273 000 000 $ US |
| 2005 | 272 400 000 $ US | 2 201 000 000 $ US |
| 2004 | 232 800 000 $ US | 1 118 000 000 $ US |
| 2003 | 228 720 000 $ US | 534 000 000 $ US |
| 2002 | 196 500 000 $ US | 826 000 000 $ US |
| 2001 | 171 790 000 $ US | 378 000 000 $ US |
| 2000 | 172 941 410 $ US | 308 000 000 $ US |
| 1999 | 176 410 171 $ US | 532 000 000 $ US |
| 1998 | 193 424 023 $ US | 506 000 000 $ US |
| 1997 | 430 056 152 $ US | 716 253 125 $ US |
| 1996 | 119 874 350 $ US | 921 976 183 $ US |
| 1995 | 55 995 588 $ US | 722 631 561 $ US |
| 1994 | 166 412 940 $ US | 421 024 638 $ US |
| 1993 | 194 479 070 $ US | 348 556 958 $ US |
| 1992 | 122 625 843 $ US | 336 479 857 $ US |
| 1991 | 48 349 174 $ US | 258 414 487 $ US |
| 1990 | 43 355 120 $ US | 245 262 963 $ US |
| 1989 | 19 741 313 $ US | 210 599 917 $ US |
| 1988 | 45 722 529 $ US | 186 491 557 $ US |
| 1987 | 59 504 202 $ US | 129 377 644 $ US |
| 1986 | 29 723 120 $ US | 105 730 332 $ US |
| 1985 | 26 162 080 $ US | 131 389 252 $ US |
| 1984 | 32 612 391 $ US | 55 510 170 $ US |
| 1983 | 37 778 898 $ US | 29 457 027 $ US |
| 1982 | 63 567 609 $ US | 63 833 092 $ US |
| 1981 | 49 264 554 $ US | 108 084 749 $ US |
| 1980 | 43 010 507 $ US | 63 632 993 $ US |
| 1979 | 46 911 742 $ US | 58 254 127 $ US |
| 1978 | 1 474 392 $ US | 32 273 193 $ US |
| 1977 | −1 218 567 $ US | 15 223 204 $ US |
| 1976 | 1 000 $ US | 8 220 530 $ US |
| 1975 | 142 711 $ US | 25 000 000 $ US |
| 1974 | 1 400 000 $ US | 4 000 000 $ US |
| 1973 | 500 000 $ US | −4 000 000 $ US |
| 1972 | 300 000 $ US | 17 000 000 $ US |
| 1971 | 300 000 $ US | 1 000 000 $ US |
| 1970 | −300 000 $ US | 23 000 000 $ US |
En 2025, les entrées nettes d'investissements directs étrangers étaient de 1,04 milliard de dollars au Sri Lanka et de 1,85 milliard de dollars au Pakistan : 1,8 fois plus au Pakistan. En 1970, elles étaient négatives au Sri Lanka, 300 000 dollars et de 23 millions de dollars au Pakistan.
Les entrées nettes d'investissements directs étrangers au Sri Lanka ont été supérieures à celles du Pakistan pendant 3 des 56 années de 1970 à 2025, et inférieures pendant 53.
Sri Lanka vs Pakistan : dernières entrées et sorties d'investissements étrangers
|
Sri Lanka
|
Pakistan
|
|
|---|---|---|
| Entrées nettes | +1,04 Md $US | +1,85 Md $US |
| Entrées nettes, % du PIB | +1,0 % | +0,5 % |
| Sorties nettes | +98,2 M $US | +267 M $US |
| Entrées nettes, total 2016–2025 | +9,05 Md $US | +21,3 Md $US |
| Rang mondial | 92/192 | 70/192 |
Comparer les investissements directs étrangers de 2 pays au choix
Sources :
- Banque mondiale | Secteur financier (1970–2025, mis à jour en octobre 2026)
Creative Commons Attribution (CC BY) : vous pouvez copier, partager, adapter et réutiliser ce contenu, y compris à des fins commerciales, à condition de citer statistics.wiki et d’indiquer les modifications apportées. Les sources citées ci-dessus peuvent avoir leurs propres conditions de licence.