
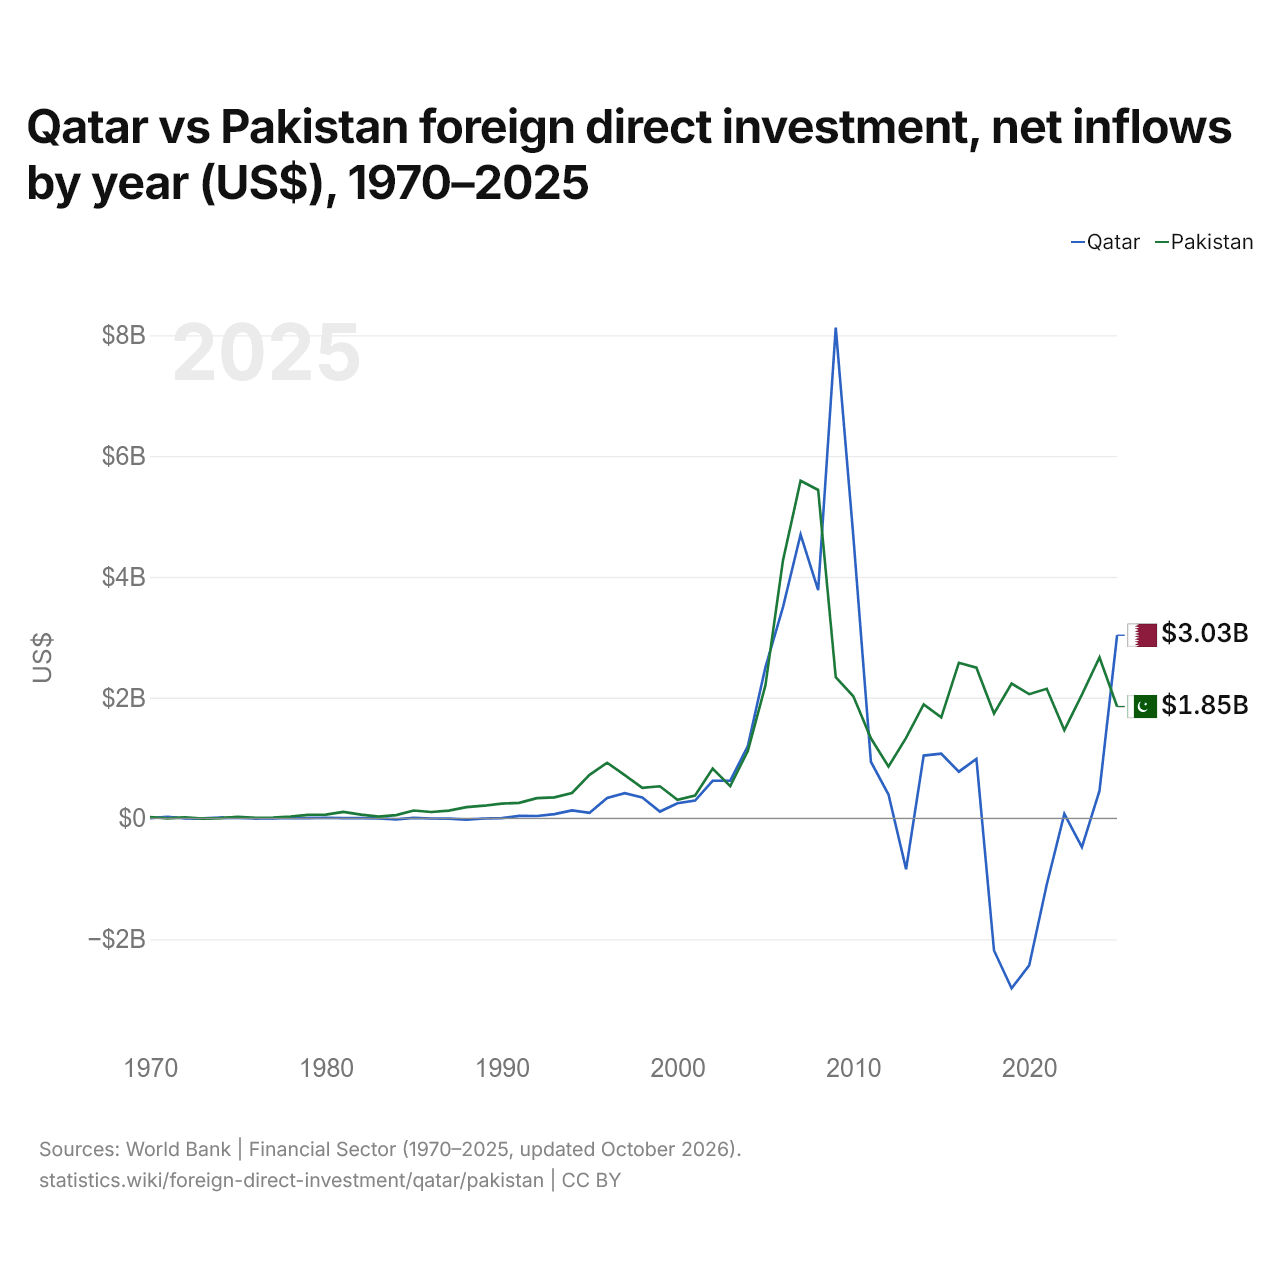
Qatar vs Pakistan : investissements directs étrangers, entrées nettes par année ($ US), 1970–2025
| Année | $ US | |
|---|---|---|
 Qatar |
 Pakistan |
|
| 2025 | 3 032 967 033 $ US | 1 852 000 000 $ US |
| 2024 | 460 164 835 $ US | 2 665 000 000 $ US |
| 2023 | −474 175 824 $ US | 2 048 000 000 $ US |
| 2022 | 76 098 901 $ US | 1 462 000 000 $ US |
| 2021 | −1 093 406 593 $ US | 2 147 000 000 $ US |
| 2020 | −2 434 065 934 $ US | 2 057 000 000 $ US |
| 2019 | −2 812 637 363 $ US | 2 234 000 000 $ US |
| 2018 | −2 186 263 736 $ US | 1 737 000 000 $ US |
| 2017 | 985 989 011 $ US | 2 496 000 000 $ US |
| 2016 | 773 901 099 $ US | 2 576 000 000 $ US |
| 2015 | 1 070 879 121 $ US | 1 673 000 000 $ US |
| 2014 | 1 040 384 615 $ US | 1 887 000 000 $ US |
| 2013 | −840 384 615 $ US | 1 333 000 000 $ US |
| 2012 | 395 879 121 $ US | 859 000 000 $ US |
| 2011 | 938 516 484 $ US | 1 326 000 000 $ US |
| 2010 | 4 670 329 670 $ US | 2 022 000 000 $ US |
| 2009 | 8 124 736 264 $ US | 2 338 000 000 $ US |
| 2008 | 3 778 626 374 $ US | 5 438 000 000 $ US |
| 2007 | 4 700 000 000 $ US | 5 590 000 000 $ US |
| 2006 | 3 500 000 000 $ US | 4 273 000 000 $ US |
| 2005 | 2 500 000 000 $ US | 2 201 000 000 $ US |
| 2004 | 1 198 970 000 $ US | 1 118 000 000 $ US |
| 2003 | 624 920 000 $ US | 534 000 000 $ US |
| 2002 | 623 920 000 $ US | 826 000 000 $ US |
| 2001 | 295 520 000 $ US | 378 000 000 $ US |
| 2000 | 251 600 000 $ US | 308 000 000 $ US |
| 1999 | 113 250 000 $ US | 532 000 000 $ US |
| 1998 | 347 300 000 $ US | 506 000 000 $ US |
| 1997 | 418 330 000 $ US | 716 253 125 $ US |
| 1996 | 338 870 000 $ US | 921 976 183 $ US |
| 1995 | 93 560 000 $ US | 722 631 561 $ US |
| 1994 | 131 850 000 $ US | 421 024 638 $ US |
| 1993 | 72 050 000 $ US | 348 556 958 $ US |
| 1992 | 39 580 000 $ US | 336 479 857 $ US |
| 1991 | 42 540 000 $ US | 258 414 487 $ US |
| 1990 | 4 880 000 $ US | 245 262 963 $ US |
| 1989 | −1 500 000 $ US | 210 599 917 $ US |
| 1988 | −20 630 000 $ US | 186 491 557 $ US |
| 1987 | −2 970 000 $ US | 129 377 644 $ US |
| 1986 | −1 470 000 $ US | 105 730 332 $ US |
| 1985 | 7 970 000 $ US | 131 389 252 $ US |
| 1984 | −14 940 000 $ US | 55 510 170 $ US |
| 1983 | 950 000 $ US | 29 457 027 $ US |
| 1982 | 3 710 000 $ US | 63 833 092 $ US |
| 1981 | 3 780 000 $ US | 108 084 749 $ US |
| 1980 | 10 840 000 $ US | 63 632 993 $ US |
| 1979 | 4 570 000 $ US | 58 254 127 $ US |
| 1978 | 8 910 000 $ US | 32 273 193 $ US |
| 1977 | 2 020 000 $ US | 15 223 204 $ US |
| 1976 | 200 000 $ US | 8 220 530 $ US |
| 1975 | 9 120 000 $ US | 25 000 000 $ US |
| 1974 | 12 970 000 $ US | 4 000 000 $ US |
| 1973 | 1 320 000 $ US | −4 000 000 $ US |
| 1972 | 10 000 $ US | 17 000 000 $ US |
| 1971 | 27 340 000 $ US | 1 000 000 $ US |
| 1970 | 5 690 000 $ US | 23 000 000 $ US |
En 2025, les entrées nettes d'investissements directs étrangers étaient de 3,03 milliards de dollars au Qatar et de 1,85 milliard de dollars au Pakistan : 1,6 fois plus au Qatar. En 1970, elles étaient de 5,69 millions de dollars au Qatar et de 23 millions de dollars au Pakistan.
Les entrées nettes d'investissements directs étrangers au Qatar ont été supérieures à celles du Pakistan pendant 9 des 56 années de 1970 à 2025, et inférieures pendant 47.
Qatar vs Pakistan : dernières entrées et sorties d'investissements étrangers
|
Qatar
|
Pakistan
|
|
|---|---|---|
| Entrées nettes | +3,03 Md $US | +1,85 Md $US |
| Entrées nettes, % du PIB | +1,4 % | +0,5 % |
| Sorties nettes | +3,34 Md $US | +267 M $US |
| Entrées nettes, total 2016–2025 | −3,67 Md $US | +21,3 Md $US |
| Rang mondial | 58/192 | 70/192 |
Comparer les investissements directs étrangers de 2 pays au choix
Sources :
- Banque mondiale | Secteur financier (1970–2025, mis à jour en octobre 2026)
Creative Commons Attribution (CC BY) : vous pouvez copier, partager, adapter et réutiliser ce contenu, y compris à des fins commerciales, à condition de citer statistics.wiki et d’indiquer les modifications apportées. Les sources citées ci-dessus peuvent avoir leurs propres conditions de licence.