
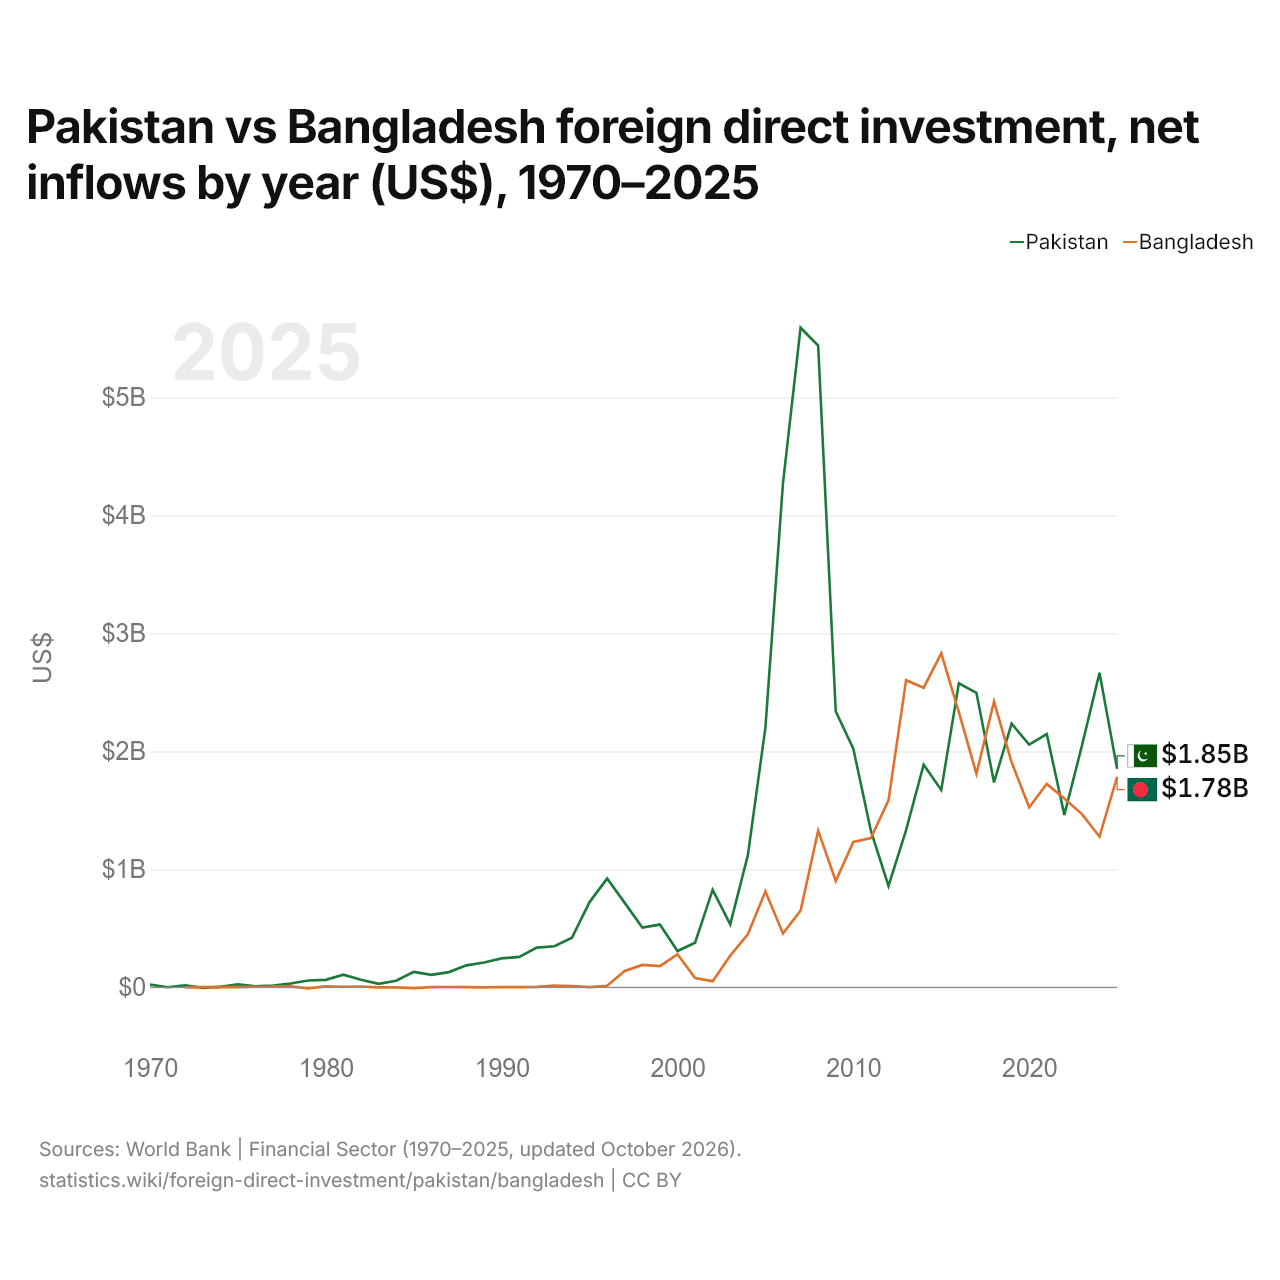
Pakistan vs Bangladesh : investissements directs étrangers, entrées nettes par année ($ US), 1970–2025
| Année | $ US | |
|---|---|---|
 Pakistan |
 Bangladesh |
|
| 2025 | 1 852 000 000 $ US | 1 784 539 607 $ US |
| 2024 | 2 665 000 000 $ US | 1 277 757 513 $ US |
| 2023 | 2 048 000 000 $ US | 1 468 497 340 $ US |
| 2022 | 1 462 000 000 $ US | 1 601 074 338 $ US |
| 2021 | 2 147 000 000 $ US | 1 723 856 464 $ US |
| 2020 | 2 057 000 000 $ US | 1 525 312 160 $ US |
| 2019 | 2 234 000 000 $ US | 1 908 045 387 $ US |
| 2018 | 1 737 000 000 $ US | 2 421 626 238 $ US |
| 2017 | 2 496 000 000 $ US | 1 810 395 804 $ US |
| 2016 | 2 576 000 000 $ US | 2 332 724 781 $ US |
| 2015 | 1 673 000 000 $ US | 2 831 152 765 $ US |
| 2014 | 1 887 000 000 $ US | 2 539 190 940 $ US |
| 2013 | 1 333 000 000 $ US | 2 602 962 095 $ US |
| 2012 | 859 000 000 $ US | 1 584 403 460 $ US |
| 2011 | 1 326 000 000 $ US | 1 264 725 163 $ US |
| 2010 | 2 022 000 000 $ US | 1 232 258 247 $ US |
| 2009 | 2 338 000 000 $ US | 901 286 583 $ US |
| 2008 | 5 438 000 000 $ US | 1 328 422 987 $ US |
| 2007 | 5 590 000 000 $ US | 651 029 738 $ US |
| 2006 | 4 273 000 000 $ US | 456 523 168 $ US |
| 2005 | 2 201 000 000 $ US | 813 321 972 $ US |
| 2004 | 1 118 000 000 $ US | 448 905 401 $ US |
| 2003 | 534 000 000 $ US | 268 285 232 $ US |
| 2002 | 826 000 000 $ US | 52 304 931 $ US |
| 2001 | 378 000 000 $ US | 78 527 040 $ US |
| 2000 | 308 000 000 $ US | 280 384 630 $ US |
| 1999 | 532 000 000 $ US | 179 603 006 $ US |
| 1998 | 506 000 000 $ US | 190 059 373 $ US |
| 1997 | 716 253 125 $ US | 139 376 153 $ US |
| 1996 | 921 976 183 $ US | 13 529 832 $ US |
| 1995 | 722 631 561 $ US | 1 896 372 $ US |
| 1994 | 421 024 638 $ US | 11 147 788 $ US |
| 1993 | 348 556 958 $ US | 14 049 887 $ US |
| 1992 | 336 479 857 $ US | 3 721 853 $ US |
| 1991 | 258 414 487 $ US | 1 390 444 $ US |
| 1990 | 245 262 963 $ US | 3 238 781 $ US |
| 1989 | 210 599 917 $ US | 247 908 $ US |
| 1988 | 186 491 557 $ US | 1 838 242 $ US |
| 1987 | 129 377 644 $ US | 3 205 087 $ US |
| 1986 | 105 730 332 $ US | 2 436 499 $ US |
| 1985 | 131 389 252 $ US | −6 660 000 $ US |
| 1984 | 55 510 170 $ US | −553 269 $ US |
| 1983 | 29 457 027 $ US | 403 979 $ US |
| 1982 | 63 833 092 $ US | 6 960 000 $ US |
| 1981 | 108 084 749 $ US | 5 360 000 $ US |
| 1980 | 63 632 993 $ US | 8 510 000 $ US |
| 1979 | 58 254 127 $ US | −8 010 000 $ US |
| 1978 | 32 273 193 $ US | 7 700 000 $ US |
| 1977 | 15 223 204 $ US | 6 980 000 $ US |
| 1976 | 8 220 530 $ US | 5 420 000 $ US |
| 1975 | 25 000 000 $ US | 1 543 333 $ US |
| 1974 | 4 000 000 $ US | 2 200 000 $ US |
| 1973 | −4 000 000 $ US | 2 340 000 $ US |
| 1972 | 17 000 000 $ US | 90 000 $ US |
| 1971 | 1 000 000 $ US | - |
| 1970 | 23 000 000 $ US | - |
En 2025, les entrées nettes d'investissements directs étrangers étaient de 1,85 milliard de dollars au Pakistan et de 1,78 milliard de dollars au Bangladesh : 3,8 % de plus au Pakistan. En 1972, elles étaient de 17 millions de dollars au Pakistan et de 90 000 dollars au Bangladesh.
Les entrées nettes d'investissements directs étrangers au Pakistan ont été supérieures à celles du Bangladesh pendant 47 des 54 années de 1972 à 2025, et inférieures pendant 7.
Pakistan vs Bangladesh : dernières entrées et sorties d'investissements étrangers
|
Pakistan
|
Bangladesh
|
|
|---|---|---|
| Entrées nettes | +1,85 Md $US | +1,78 Md $US |
| Entrées nettes, % du PIB | +0,5 % | +0,4 % |
| Sorties nettes | +267 M $US | +34,4 M $US |
| Entrées nettes, total 2016–2025 | +21,3 Md $US | +17,9 Md $US |
| Rang mondial | 70/192 | 73/192 |
Comparer les investissements directs étrangers de 2 pays au choix
Sources :
- Banque mondiale | Secteur financier (1970–2025, mis à jour en octobre 2026)
Creative Commons Attribution (CC BY) : vous pouvez copier, partager, adapter et réutiliser ce contenu, y compris à des fins commerciales, à condition de citer statistics.wiki et d’indiquer les modifications apportées. Les sources citées ci-dessus peuvent avoir leurs propres conditions de licence.