
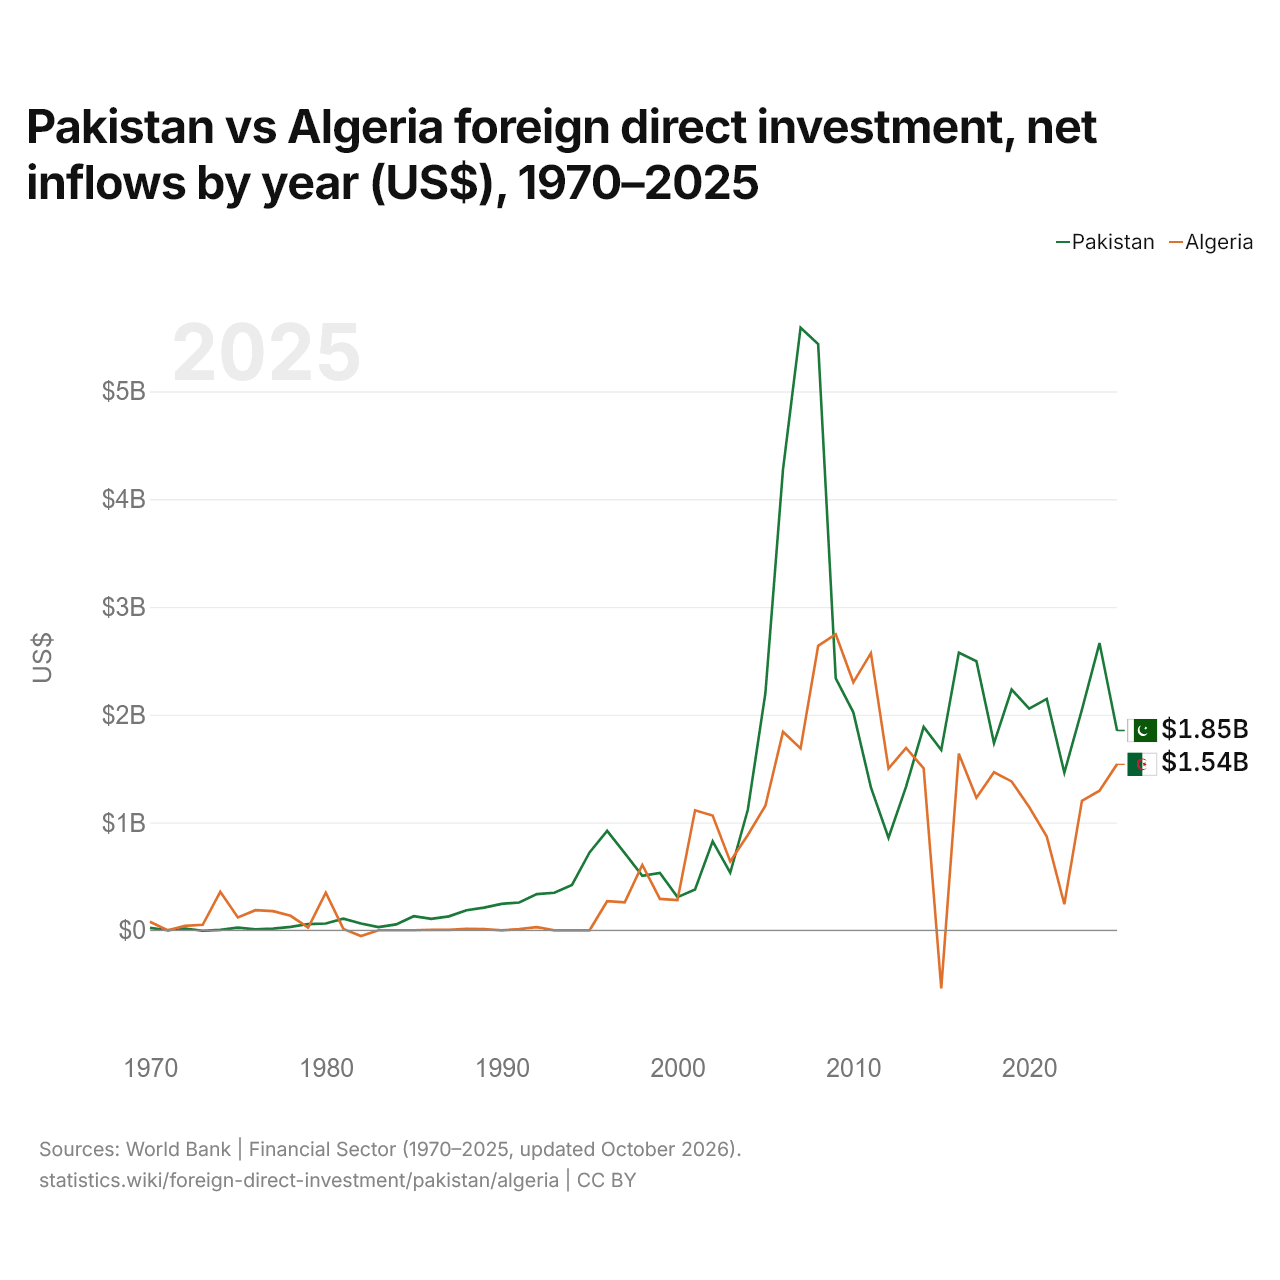
Pakistan vs Algérie : investissements directs étrangers, entrées nettes par année ($ US), 1970–2025
| Année | $ US | |
|---|---|---|
 Pakistan |
 Algérie |
|
| 2025 | 1 852 000 000 $ US | 1 541 664 825 $ US |
| 2024 | 2 665 000 000 $ US | 1 295 537 014 $ US |
| 2023 | 2 048 000 000 $ US | 1 201 490 230 $ US |
| 2022 | 1 462 000 000 $ US | 241 796 030 $ US |
| 2021 | 2 147 000 000 $ US | 869 194 073 $ US |
| 2020 | 2 057 000 000 $ US | 1 143 918 160 $ US |
| 2019 | 2 234 000 000 $ US | 1 381 200 050 $ US |
| 2018 | 1 737 000 000 $ US | 1 466 116 068 $ US |
| 2017 | 2 496 000 000 $ US | 1 230 243 451 $ US |
| 2016 | 2 576 000 000 $ US | 1 638 263 954 $ US |
| 2015 | 1 673 000 000 $ US | −537 792 921 $ US |
| 2014 | 1 887 000 000 $ US | 1 502 206 171 $ US |
| 2013 | 1 333 000 000 $ US | 1 691 886 708 $ US |
| 2012 | 859 000 000 $ US | 1 500 402 453 $ US |
| 2011 | 1 326 000 000 $ US | 2 571 237 025 $ US |
| 2010 | 2 022 000 000 $ US | 2 300 369 124 $ US |
| 2009 | 2 338 000 000 $ US | 2 746 930 734 $ US |
| 2008 | 5 438 000 000 $ US | 2 638 607 034 $ US |
| 2007 | 5 590 000 000 $ US | 1 686 736 540 $ US |
| 2006 | 4 273 000 000 $ US | 1 841 000 000 $ US |
| 2005 | 2 201 000 000 $ US | 1 156 000 000 $ US |
| 2004 | 1 118 000 000 $ US | 884 749 028 $ US |
| 2003 | 534 000 000 $ US | 637 853 027 $ US |
| 2002 | 826 000 000 $ US | 1 064 960 000 $ US |
| 2001 | 378 000 000 $ US | 1 113 105 541 $ US |
| 2000 | 308 000 000 $ US | 280 100 000 $ US |
| 1999 | 532 000 000 $ US | 291 600 000 $ US |
| 1998 | 506 000 000 $ US | 606 600 000 $ US |
| 1997 | 716 253 125 $ US | 260 000 000 $ US |
| 1996 | 921 976 183 $ US | 270 000 000 $ US |
| 1995 | 722 631 561 $ US | 1 000 $ US |
| 1994 | 421 024 638 $ US | 1 000 $ US |
| 1993 | 348 556 958 $ US | 1 000 $ US |
| 1992 | 336 479 857 $ US | 30 000 000 $ US |
| 1991 | 258 414 487 $ US | 11 638 686 $ US |
| 1990 | 245 262 963 $ US | 334 915 $ US |
| 1989 | 210 599 917 $ US | 12 091 647 $ US |
| 1988 | 186 491 557 $ US | 13 018 265 $ US |
| 1987 | 129 377 644 $ US | 3 711 538 $ US |
| 1986 | 105 730 332 $ US | 5 316 528 $ US |
| 1985 | 131 389 252 $ US | 397 788 $ US |
| 1984 | 55 510 170 $ US | 802 669 $ US |
| 1983 | 29 457 027 $ US | 417 641 $ US |
| 1982 | 63 833 092 $ US | −53 569 193 $ US |
| 1981 | 108 084 749 $ US | 13 207 259 $ US |
| 1980 | 63 632 993 $ US | 348 669 038 $ US |
| 1979 | 58 254 127 $ US | 25 692 486 $ US |
| 1978 | 32 273 193 $ US | 135 152 172 $ US |
| 1977 | 15 223 204 $ US | 178 452 647 $ US |
| 1976 | 8 220 530 $ US | 187 000 000 $ US |
| 1975 | 25 000 000 $ US | 119 000 000 $ US |
| 1974 | 4 000 000 $ US | 358 000 000 $ US |
| 1973 | −4 000 000 $ US | 51 000 000 $ US |
| 1972 | 17 000 000 $ US | 41 490 000 $ US |
| 1971 | 1 000 000 $ US | 600 000 $ US |
| 1970 | 23 000 000 $ US | 80 120 000 $ US |
En 2025, les entrées nettes d'investissements directs étrangers étaient de 1,85 milliard de dollars au Pakistan et de 1,54 milliard de dollars en Algérie : 20 % de plus au Pakistan. En 1970, elles étaient de 23 millions de dollars au Pakistan et de 80,1 millions de dollars en Algérie.
Les entrées nettes d'investissements directs étrangers au Pakistan ont été supérieures à celles de l'Algérie pendant 38 des 56 années de 1970 à 2025, et inférieures pendant 18.
Pakistan vs Algérie : dernières entrées et sorties d'investissements étrangers
|
Pakistan
|
Algérie
|
|
|---|---|---|
| Entrées nettes | +1,85 Md $US | +1,54 Md $US |
| Entrées nettes, % du PIB | +0,5 % | +0,5 % |
| Sorties nettes | +267 M $US | +47,6 M $US |
| Entrées nettes, total 2016–2025 | +21,3 Md $US | +12,0 Md $US |
| Rang mondial | 70/192 | 80/192 |
Comparer les investissements directs étrangers de 2 pays au choix
Sources :
- Banque mondiale | Secteur financier (1970–2025, mis à jour en octobre 2026)
Creative Commons Attribution (CC BY) : vous pouvez copier, partager, adapter et réutiliser ce contenu, y compris à des fins commerciales, à condition de citer statistics.wiki et d’indiquer les modifications apportées. Les sources citées ci-dessus peuvent avoir leurs propres conditions de licence.