
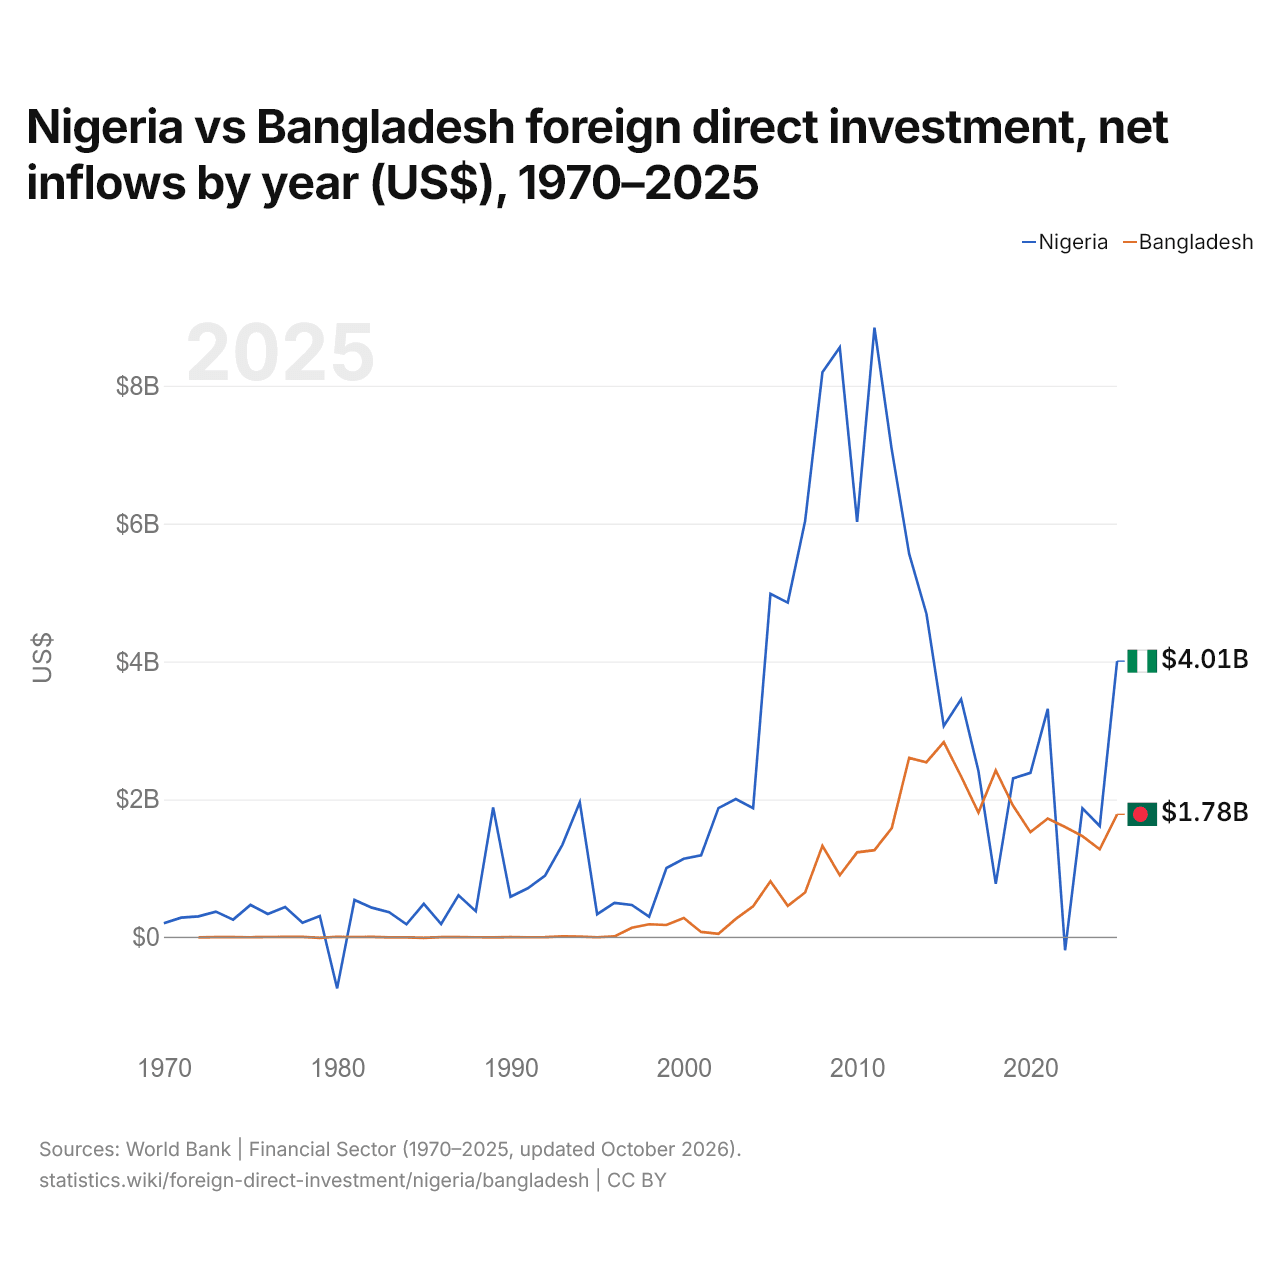
Nigeria vs Bangladesh : investissements directs étrangers, entrées nettes par année ($ US), 1970–2025
| Année | $ US | |
|---|---|---|
 Nigeria |
 Bangladesh |
|
| 2025 | 4 005 360 387 $ US | 1 784 539 607 $ US |
| 2024 | 1 614 032 957 $ US | 1 277 757 513 $ US |
| 2023 | 1 872 520 530 $ US | 1 468 497 340 $ US |
| 2022 | −186 792 429 $ US | 1 601 074 338 $ US |
| 2021 | 3 313 210 000 $ US | 1 723 856 464 $ US |
| 2020 | 2 385 277 666 $ US | 1 525 312 160 $ US |
| 2019 | 2 305 099 812 $ US | 1 908 045 387 $ US |
| 2018 | 775 247 400 $ US | 2 421 626 238 $ US |
| 2017 | 2 412 974 916 $ US | 1 810 395 804 $ US |
| 2016 | 3 453 258 408 $ US | 2 332 724 781 $ US |
| 2015 | 3 064 168 904 $ US | 2 831 152 765 $ US |
| 2014 | 4 693 828 632 $ US | 2 539 190 940 $ US |
| 2013 | 5 562 857 987 $ US | 2 602 962 095 $ US |
| 2012 | 7 069 908 428 $ US | 1 584 403 460 $ US |
| 2011 | 8 841 062 051 $ US | 1 264 725 163 $ US |
| 2010 | 6 026 253 091 $ US | 1 232 258 247 $ US |
| 2009 | 8 555 990 007 $ US | 901 286 583 $ US |
| 2008 | 8 194 071 895 $ US | 1 328 422 987 $ US |
| 2007 | 6 036 021 405 $ US | 651 029 738 $ US |
| 2006 | 4 854 353 979 $ US | 456 523 168 $ US |
| 2005 | 4 982 533 930 $ US | 813 321 972 $ US |
| 2004 | 1 874 060 887 $ US | 448 905 401 $ US |
| 2003 | 2 005 353 563 $ US | 268 285 232 $ US |
| 2002 | 1 874 070 753 $ US | 52 304 931 $ US |
| 2001 | 1 190 618 644 $ US | 78 527 040 $ US |
| 2000 | 1 140 167 556 $ US | 280 384 630 $ US |
| 1999 | 1 004 915 631 $ US | 179 603 006 $ US |
| 1998 | 299 566 658 $ US | 190 059 373 $ US |
| 1997 | 469 577 020 $ US | 139 376 153 $ US |
| 1996 | 499 276 809 $ US | 13 529 832 $ US |
| 1995 | 335 842 165 $ US | 1 896 372 $ US |
| 1994 | 1 959 219 858 $ US | 11 147 788 $ US |
| 1993 | 1 345 368 587 $ US | 14 049 887 $ US |
| 1992 | 896 641 282 $ US | 3 721 853 $ US |
| 1991 | 712 373 362 $ US | 1 390 444 $ US |
| 1990 | 587 882 971 $ US | 3 238 781 $ US |
| 1989 | 1 884 249 739 $ US | 247 908 $ US |
| 1988 | 378 667 098 $ US | 1 838 242 $ US |
| 1987 | 610 552 091 $ US | 3 205 087 $ US |
| 1986 | 193 214 908 $ US | 2 436 499 $ US |
| 1985 | 485 581 321 $ US | −6 660 000 $ US |
| 1984 | 189 164 785 $ US | −553 269 $ US |
| 1983 | 364 434 580 $ US | 403 979 $ US |
| 1982 | 430 611 256 $ US | 6 960 000 $ US |
| 1981 | 542 327 289 $ US | 5 360 000 $ US |
| 1980 | −738 870 004 $ US | 8 510 000 $ US |
| 1979 | 309 598 869 $ US | −8 010 000 $ US |
| 1978 | 210 933 271 $ US | 7 700 000 $ US |
| 1977 | 440 514 242 $ US | 6 980 000 $ US |
| 1976 | 339 000 000 $ US | 5 420 000 $ US |
| 1975 | 470 120 000 $ US | 1 543 333 $ US |
| 1974 | 257 000 000 $ US | 2 200 000 $ US |
| 1973 | 373 000 000 $ US | 2 340 000 $ US |
| 1972 | 305 000 000 $ US | 90 000 $ US |
| 1971 | 286 000 000 $ US | - |
| 1970 | 205 000 000 $ US | - |
En 2025, les entrées nettes d'investissements directs étrangers étaient de 4,01 milliards de dollars au Nigeria et de 1,78 milliard de dollars au Bangladesh : 2,2 fois plus au Nigeria. En 1972, elles étaient de 305 millions de dollars au Nigeria et de 90 000 dollars au Bangladesh.
Les entrées nettes d'investissements directs étrangers au Nigeria ont été supérieures à celles du Bangladesh pendant 51 des 54 années de 1972 à 2025, et inférieures pendant 3.
Nigeria vs Bangladesh : dernières entrées et sorties d'investissements étrangers
|
Nigeria
|
Bangladesh
|
|
|---|---|---|
| Entrées nettes | +4,01 Md $US | +1,78 Md $US |
| Entrées nettes, % du PIB | +1,4 % | +0,4 % |
| Sorties nettes | +1,19 Md $US | +34,4 M $US |
| Entrées nettes, total 2016–2025 | +22,0 Md $US | +17,9 Md $US |
| Rang mondial | 51/192 | 73/192 |
Comparer les investissements directs étrangers de 2 pays au choix
Sources :
- Banque mondiale | Secteur financier (1970–2025, mis à jour en octobre 2026)
Creative Commons Attribution (CC BY) : vous pouvez copier, partager, adapter et réutiliser ce contenu, y compris à des fins commerciales, à condition de citer statistics.wiki et d’indiquer les modifications apportées. Les sources citées ci-dessus peuvent avoir leurs propres conditions de licence.