
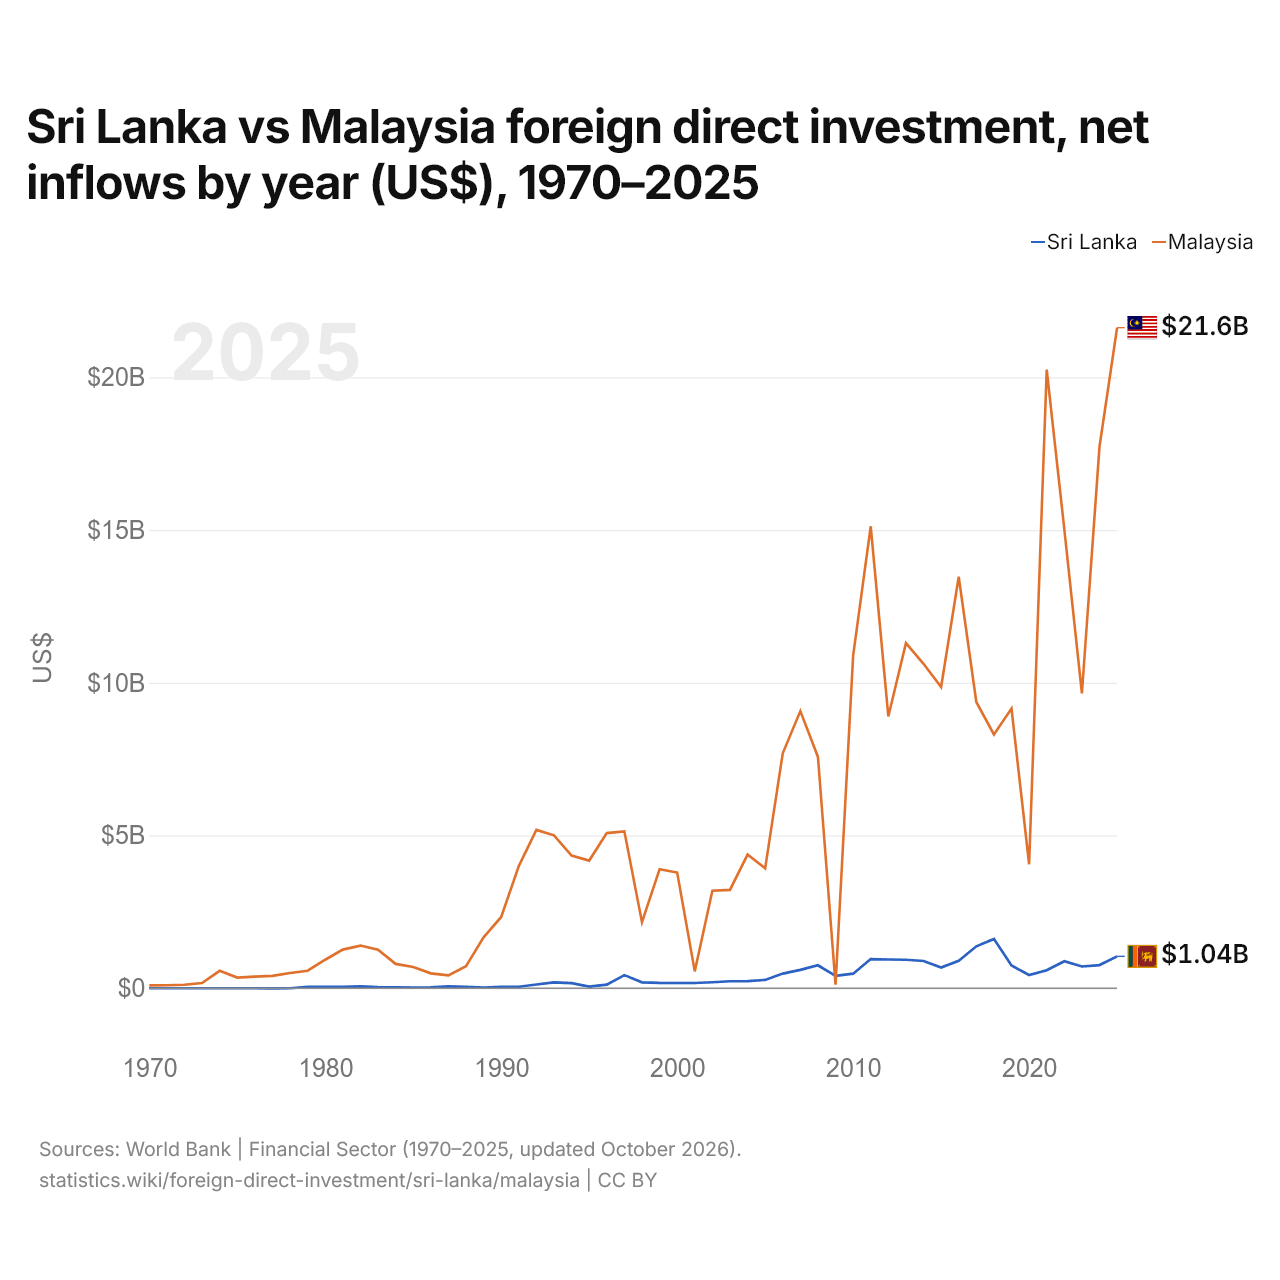
Sri Lanka vs Malaisie : investissements directs étrangers, entrées nettes par année ($ US), 1970–2025
| Année | $ US | |
|---|---|---|
 Sri Lanka |
 Malaisie |
|
| 2025 | 1 043 936 118 $ US | 21 618 816 971 $ US |
| 2024 | 759 240 352 $ US | 17 724 927 818 $ US |
| 2023 | 713 015 365 $ US | 9 652 698 629 $ US |
| 2022 | 884 150 491 $ US | 15 027 992 711 $ US |
| 2021 | 592 289 970 $ US | 20 245 157 327 $ US |
| 2020 | 434 075 668 $ US | 4 058 769 679 $ US |
| 2019 | 743 466 231 $ US | 9 154 921 685 $ US |
| 2018 | 1 614 044 009 $ US | 8 304 480 742 $ US |
| 2017 | 1 372 723 043 $ US | 9 368 469 823 $ US |
| 2016 | 897 049 376 $ US | 13 470 089 921 $ US |
| 2015 | 679 655 644 $ US | 9 857 162 112 $ US |
| 2014 | 893 628 980 $ US | 10 619 431 583 $ US |
| 2013 | 932 551 318 $ US | 11 296 279 514 $ US |
| 2012 | 941 116 591 $ US | 8 895 774 251 $ US |
| 2011 | 955 920 000 $ US | 15 119 439 204 $ US |
| 2010 | 477 559 000 $ US | 10 885 801 852 $ US |
| 2009 | 404 000 000 $ US | 114 664 435 $ US |
| 2008 | 752 200 000 $ US | 7 572 512 432 $ US |
| 2007 | 603 000 000 $ US | 9 071 369 835 $ US |
| 2006 | 479 700 000 $ US | 7 690 731 246 $ US |
| 2005 | 272 400 000 $ US | 3 924 786 635 $ US |
| 2004 | 232 800 000 $ US | 4 376 052 632 $ US |
| 2003 | 228 720 000 $ US | 3 218 947 368 $ US |
| 2002 | 196 500 000 $ US | 3 192 894 737 $ US |
| 2001 | 171 790 000 $ US | 553 947 368 $ US |
| 2000 | 172 941 410 $ US | 3 787 631 579 $ US |
| 1999 | 176 410 171 $ US | 3 895 263 158 $ US |
| 1998 | 193 424 023 $ US | 2 163 401 816 $ US |
| 1997 | 430 056 152 $ US | 5 136 514 576 $ US |
| 1996 | 119 874 350 $ US | 5 078 414 948 $ US |
| 1995 | 55 995 588 $ US | 4 178 239 335 $ US |
| 1994 | 166 412 940 $ US | 4 341 800 916 $ US |
| 1993 | 194 479 070 $ US | 5 005 642 760 $ US |
| 1992 | 122 625 843 $ US | 5 183 358 086 $ US |
| 1991 | 48 349 174 $ US | 3 998 448 522 $ US |
| 1990 | 43 355 120 $ US | 2 332 455 289 $ US |
| 1989 | 19 741 313 $ US | 1 667 871 569 $ US |
| 1988 | 45 722 529 $ US | 719 418 050 $ US |
| 1987 | 59 504 202 $ US | 422 679 710 $ US |
| 1986 | 29 723 120 $ US | 488 874 111 $ US |
| 1985 | 26 162 080 $ US | 694 712 466 $ US |
| 1984 | 32 612 391 $ US | 797 476 861 $ US |
| 1983 | 37 778 898 $ US | 1 260 527 733 $ US |
| 1982 | 63 567 609 $ US | 1 397 196 045 $ US |
| 1981 | 49 264 554 $ US | 1 264 688 331 $ US |
| 1980 | 43 010 507 $ US | 933 903 976 $ US |
| 1979 | 46 911 742 $ US | 573 467 422 $ US |
| 1978 | 1 474 392 $ US | 499 991 005 $ US |
| 1977 | −1 218 567 $ US | 405 885 819 $ US |
| 1976 | 1 000 $ US | 381 259 652 $ US |
| 1975 | 142 711 $ US | 350 491 203 $ US |
| 1974 | 1 400 000 $ US | 570 819 255 $ US |
| 1973 | 500 000 $ US | 172 000 000 $ US |
| 1972 | 300 000 $ US | 114 000 000 $ US |
| 1971 | 300 000 $ US | 100 000 000 $ US |
| 1970 | −300 000 $ US | 94 000 000 $ US |
En 2025, les entrées nettes d'investissements directs étrangers étaient de 1,04 milliard de dollars au Sri Lanka et de 21,6 milliards de dollars en Malaisie : 21 fois plus en Malaisie. En 1970, elles étaient négatives au Sri Lanka, 300 000 dollars et de 94 millions de dollars en Malaisie.
Les entrées nettes d'investissements directs étrangers au Sri Lanka ont été supérieures à celles de la Malaisie pendant une des 56 années de 1970 à 2025, et inférieures pendant 55.
Sri Lanka vs Malaisie : dernières entrées et sorties d'investissements étrangers
|
Sri Lanka
|
Malaisie
|
|
|---|---|---|
| Entrées nettes | +1,04 Md $US | +21,6 Md $US |
| Entrées nettes, % du PIB | +1,0 % | +4,6 % |
| Sorties nettes | +98,2 M $US | +9,09 Md $US |
| Entrées nettes, total 2016–2025 | +9,05 Md $US | +129 Md $US |
| Rang mondial | 92/192 | 21/192 |
Comparer les investissements directs étrangers de 2 pays au choix
Sources :
- Banque mondiale | Secteur financier (1970–2025, mis à jour en octobre 2026)
Creative Commons Attribution (CC BY) : vous pouvez copier, partager, adapter et réutiliser ce contenu, y compris à des fins commerciales, à condition de citer statistics.wiki et d’indiquer les modifications apportées. Les sources citées ci-dessus peuvent avoir leurs propres conditions de licence.