
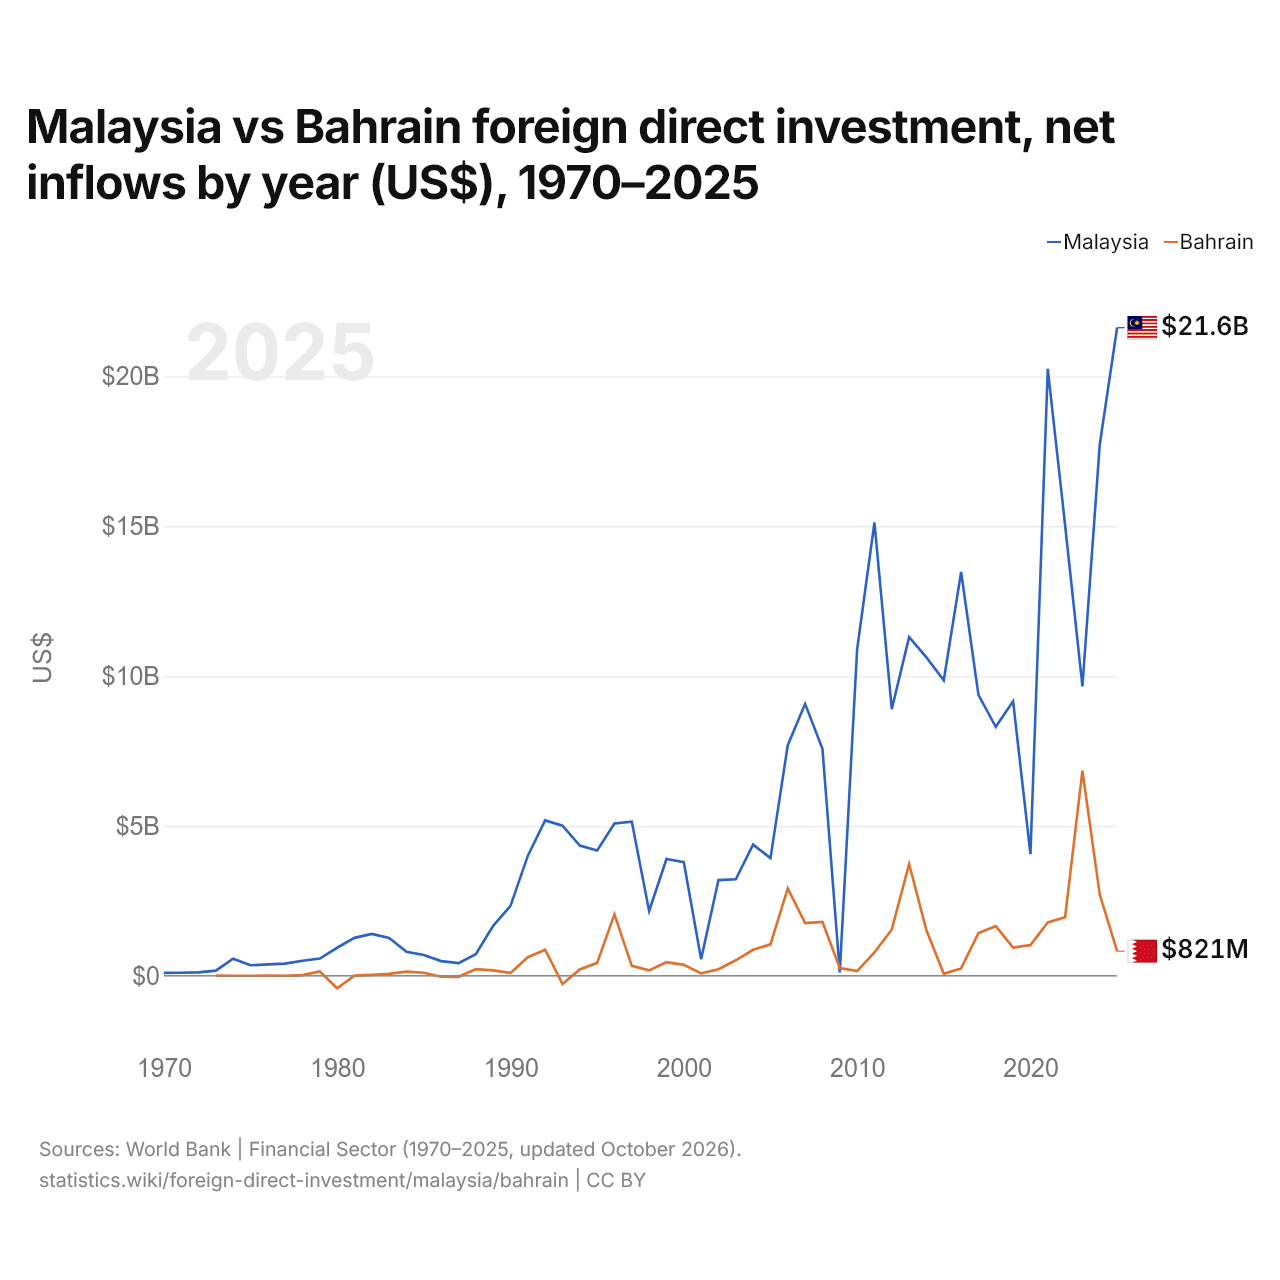
Malaisie vs Bahreïn : investissements directs étrangers, entrées nettes par année ($ US), 1970–2025
| Année | $ US | |
|---|---|---|
 Malaisie |
 Bahreïn |
|
| 2025 | 21 618 816 971 $ US | 821 170 213 $ US |
| 2024 | 17 724 927 818 $ US | 2 702 659 574 $ US |
| 2023 | 9 652 698 629 $ US | 6 839 627 660 $ US |
| 2022 | 15 027 992 711 $ US | 1 951 329 787 $ US |
| 2021 | 20 245 157 327 $ US | 1 779 255 319 $ US |
| 2020 | 4 058 769 679 $ US | 1 021 276 596 $ US |
| 2019 | 9 154 921 685 $ US | 941 755 319 $ US |
| 2018 | 8 304 480 742 $ US | 1 654 255 319 $ US |
| 2017 | 9 368 469 823 $ US | 1 426 063 830 $ US |
| 2016 | 13 470 089 921 $ US | 243 351 064 $ US |
| 2015 | 9 857 162 112 $ US | 64 893 617 $ US |
| 2014 | 10 619 431 583 $ US | 1 518 617 021 $ US |
| 2013 | 11 296 279 514 $ US | 3 727 712 766 $ US |
| 2012 | 8 895 774 251 $ US | 1 544 680 851 $ US |
| 2011 | 15 119 439 204 $ US | 780 851 064 $ US |
| 2010 | 10 885 801 852 $ US | 155 771 009 $ US |
| 2009 | 114 664 435 $ US | 257 149 561 $ US |
| 2008 | 7 572 512 432 $ US | 1 793 998 355 $ US |
| 2007 | 9 071 369 835 $ US | 1 756 312 515 $ US |
| 2006 | 7 690 731 246 $ US | 2 914 659 868 $ US |
| 2005 | 3 924 786 635 $ US | 1 048 601 306 $ US |
| 2004 | 4 376 052 632 $ US | 865 308 119 $ US |
| 2003 | 3 218 947 368 $ US | 516 700 276 $ US |
| 2002 | 3 192 894 737 $ US | 216 986 882 $ US |
| 2001 | 553 947 368 $ US | 80 358 858 $ US |
| 2000 | 3 787 631 579 $ US | 363 562 322 $ US |
| 1999 | 3 895 263 158 $ US | 453 737 838 $ US |
| 1998 | 2 163 401 816 $ US | 179 454 413 $ US |
| 1997 | 5 136 514 576 $ US | 329 284 164 $ US |
| 1996 | 5 078 414 948 $ US | 2 048 151 880 $ US |
| 1995 | 4 178 239 335 $ US | 430 586 744 $ US |
| 1994 | 4 341 800 916 $ US | 208 244 700 $ US |
| 1993 | 5 005 642 760 $ US | −275 000 008 $ US |
| 1992 | 5 183 358 086 $ US | 868 617 021 $ US |
| 1991 | 3 998 448 522 $ US | 619 414 894 $ US |
| 1990 | 2 332 455 289 $ US | 91 755 319 $ US |
| 1989 | 1 667 871 569 $ US | 180 851 064 $ US |
| 1988 | 719 418 050 $ US | 222 074 468 $ US |
| 1987 | 422 679 710 $ US | −35 904 255 $ US |
| 1986 | 488 874 111 $ US | −31 914 894 $ US |
| 1985 | 694 712 466 $ US | 101 329 787 $ US |
| 1984 | 797 476 861 $ US | 140 691 490 $ US |
| 1983 | 1 260 527 733 $ US | 64 095 745 $ US |
| 1982 | 1 397 196 045 $ US | 28 457 447 $ US |
| 1981 | 1 264 688 331 $ US | 4 150 000 $ US |
| 1980 | 933 903 976 $ US | −418 036 875 $ US |
| 1979 | 573 467 422 $ US | 145 171 540 $ US |
| 1978 | 499 991 005 $ US | 22 970 508 $ US |
| 1977 | 405 885 819 $ US | 650 000 $ US |
| 1976 | 381 259 652 $ US | 3 210 000 $ US |
| 1975 | 350 491 203 $ US | 1 320 000 $ US |
| 1974 | 570 819 255 $ US | 110 000 $ US |
| 1973 | 172 000 000 $ US | 3 400 000 $ US |
| 1972 | 114 000 000 $ US | - |
| 1971 | 100 000 000 $ US | - |
| 1970 | 94 000 000 $ US | - |
En 2025, les entrées nettes d'investissements directs étrangers étaient de 21,6 milliards de dollars en Malaisie et de 821 millions de dollars à Bahreïn : 26 fois plus en Malaisie. En 1973, elles étaient de 172 millions de dollars en Malaisie et de 3,4 millions de dollars à Bahreïn.
Les entrées nettes d'investissements directs étrangers en Malaisie ont été supérieures à celles de Bahreïn pendant 52 des 53 années de 1973 à 2025, et inférieures pendant une.
Malaisie vs Bahreïn : dernières entrées et sorties d'investissements étrangers
|
Malaisie
|
Bahreïn
|
|
|---|---|---|
| Entrées nettes | +21,6 Md $US | +821 M $US |
| Entrées nettes, % du PIB | +4,6 % | +1,7 % |
| Sorties nettes | +9,09 Md $US | +550 M $US |
| Entrées nettes, total 2016–2025 | +129 Md $US | +19,4 Md $US |
| Rang mondial | 21/192 | 103/192 |
Comparer les investissements directs étrangers de 2 pays au choix
Sources :
- Banque mondiale | Secteur financier (1970–2025, mis à jour en octobre 2026)
Creative Commons Attribution (CC BY) : vous pouvez copier, partager, adapter et réutiliser ce contenu, y compris à des fins commerciales, à condition de citer statistics.wiki et d’indiquer les modifications apportées. Les sources citées ci-dessus peuvent avoir leurs propres conditions de licence.