
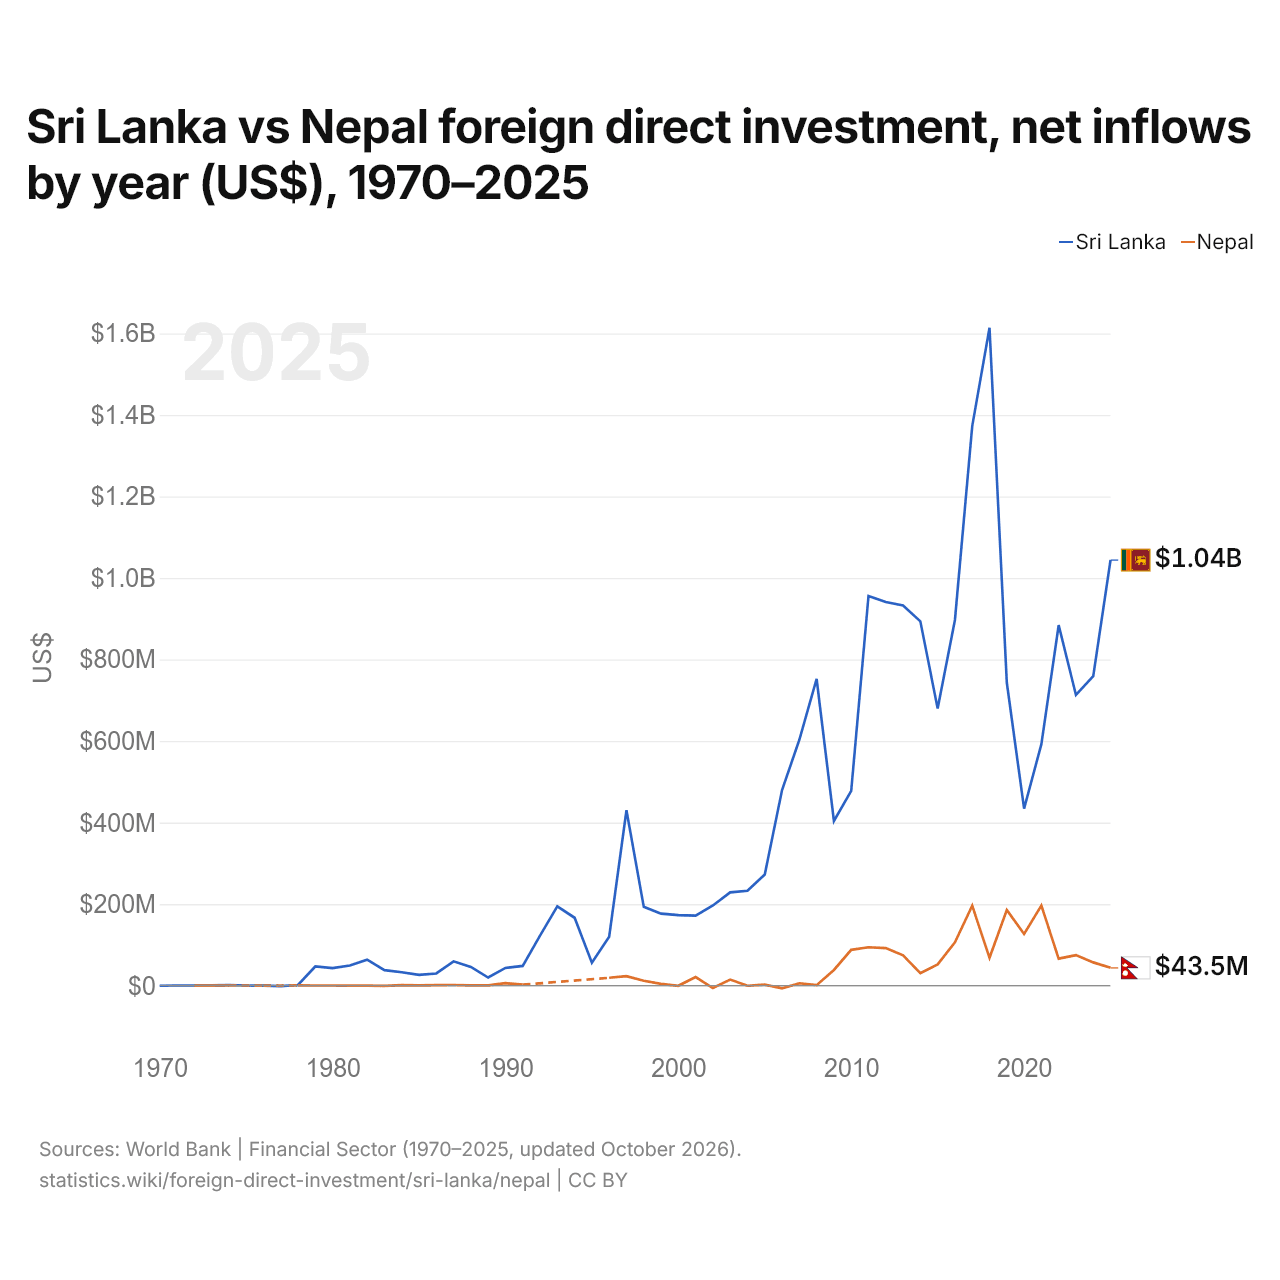
Sri Lanka vs Népal : investissements directs étrangers, entrées nettes par année ($ US), 1970–2025
| Année | $ US | |
|---|---|---|
 Sri Lanka |
 Népal |
|
| 2025 | 1 043 936 118 $ US | 43 549 530 $ US |
| 2024 | 759 240 352 $ US | 56 900 207 $ US |
| 2023 | 713 015 365 $ US | 74 821 496 $ US |
| 2022 | 884 150 491 $ US | 66 059 661 $ US |
| 2021 | 592 289 970 $ US | 196 326 024 $ US |
| 2020 | 434 075 668 $ US | 126 626 337 $ US |
| 2019 | 743 466 231 $ US | 185 563 266 $ US |
| 2018 | 1 614 044 009 $ US | 68 261 794 $ US |
| 2017 | 1 372 723 043 $ US | 196 265 099 $ US |
| 2016 | 897 049 376 $ US | 105 996 376 $ US |
| 2015 | 679 655 644 $ US | 51 895 700 $ US |
| 2014 | 893 628 980 $ US | 30 402 677 $ US |
| 2013 | 932 551 318 $ US | 74 179 633 $ US |
| 2012 | 941 116 591 $ US | 91 954 196 $ US |
| 2011 | 955 920 000 $ US | 94 022 157 $ US |
| 2010 | 477 559 000 $ US | 87 741 712 $ US |
| 2009 | 404 000 000 $ US | 38 271 270 $ US |
| 2008 | 752 200 000 $ US | 995 124 $ US |
| 2007 | 603 000 000 $ US | 5 741 706 $ US |
| 2006 | 479 700 000 $ US | −6 647 984 $ US |
| 2005 | 272 400 000 $ US | 2 451 785 $ US |
| 2004 | 232 800 000 $ US | −417 346 $ US |
| 2003 | 228 720 000 $ US | 14 778 086 $ US |
| 2002 | 196 500 000 $ US | −5 952 541 $ US |
| 2001 | 171 790 000 $ US | 20 850 000 $ US |
| 2000 | 172 941 410 $ US | −484 827 $ US |
| 1999 | 176 410 171 $ US | 4 351 069 $ US |
| 1998 | 193 424 023 $ US | 12 024 660 $ US |
| 1997 | 430 056 152 $ US | 23 056 468 $ US |
| 1996 | 119 874 350 $ US | 19 160 171 $ US |
| 1995 | 55 995 588 $ US | - |
| 1994 | 166 412 940 $ US | - |
| 1993 | 194 479 070 $ US | - |
| 1992 | 122 625 843 $ US | - |
| 1991 | 48 349 174 $ US | 2 220 000 $ US |
| 1990 | 43 355 120 $ US | 5 940 000 $ US |
| 1989 | 19 741 313 $ US | 420 000 $ US |
| 1988 | 45 722 529 $ US | 680 000 $ US |
| 1987 | 59 504 202 $ US | 1 390 000 $ US |
| 1986 | 29 723 120 $ US | 1 170 000 $ US |
| 1985 | 26 162 080 $ US | 650 000 $ US |
| 1984 | 32 612 391 $ US | 950 000 $ US |
| 1983 | 37 778 898 $ US | −600 000 $ US |
| 1982 | 63 567 609 $ US | −30 000 $ US |
| 1981 | 49 264 554 $ US | −230 000 $ US |
| 1980 | 43 010 507 $ US | 300 000 $ US |
| 1979 | 46 911 742 $ US | 300 000 $ US |
| 1978 | 1 474 392 $ US | 410 000 $ US |
| 1977 | −1 218 567 $ US | - |
| 1976 | 1 000 $ US | −40 000 $ US |
| 1975 | 142 711 $ US | - |
| 1974 | 1 400 000 $ US | 250 000 $ US |
| 1973 | 500 000 $ US | −10 000 $ US |
| 1972 | 300 000 $ US | 30 000 $ US |
| 1971 | 300 000 $ US | - |
| 1970 | −300 000 $ US | - |
En 2025, les entrées nettes d'investissements directs étrangers étaient de 1,04 milliard de dollars au Sri Lanka et de 43,5 millions de dollars au Népal : 24 fois plus au Sri Lanka. En 1972, elles étaient de 300 000 dollars au Sri Lanka et de 30 000 dollars au Népal.
Les entrées nettes d'investissements directs étrangers au Sri Lanka ont été supérieures à celles du Népal chacune des 48 années de 1972 à 2025 que les deux pays ont communiquées.
Sri Lanka vs Népal : dernières entrées et sorties d'investissements étrangers
|
Sri Lanka
|
Népal
|
|
|---|---|---|
| Entrées nettes | +1,04 Md $US | +43,5 M $US |
| Entrées nettes, % du PIB | +1,0 % | +0,1 % |
| Sorties nettes | +98,2 M $US | +17,3 k $US |
| Entrées nettes, total 2016–2025 | +9,05 Md $US | +1,12 Md $US |
| Rang mondial | 92/192 | 155/192 |
Comparer les investissements directs étrangers de 2 pays au choix
Sources :
- Banque mondiale | Secteur financier (1970–2025, mis à jour en octobre 2026)
Creative Commons Attribution (CC BY) : vous pouvez copier, partager, adapter et réutiliser ce contenu, y compris à des fins commerciales, à condition de citer statistics.wiki et d’indiquer les modifications apportées. Les sources citées ci-dessus peuvent avoir leurs propres conditions de licence.