
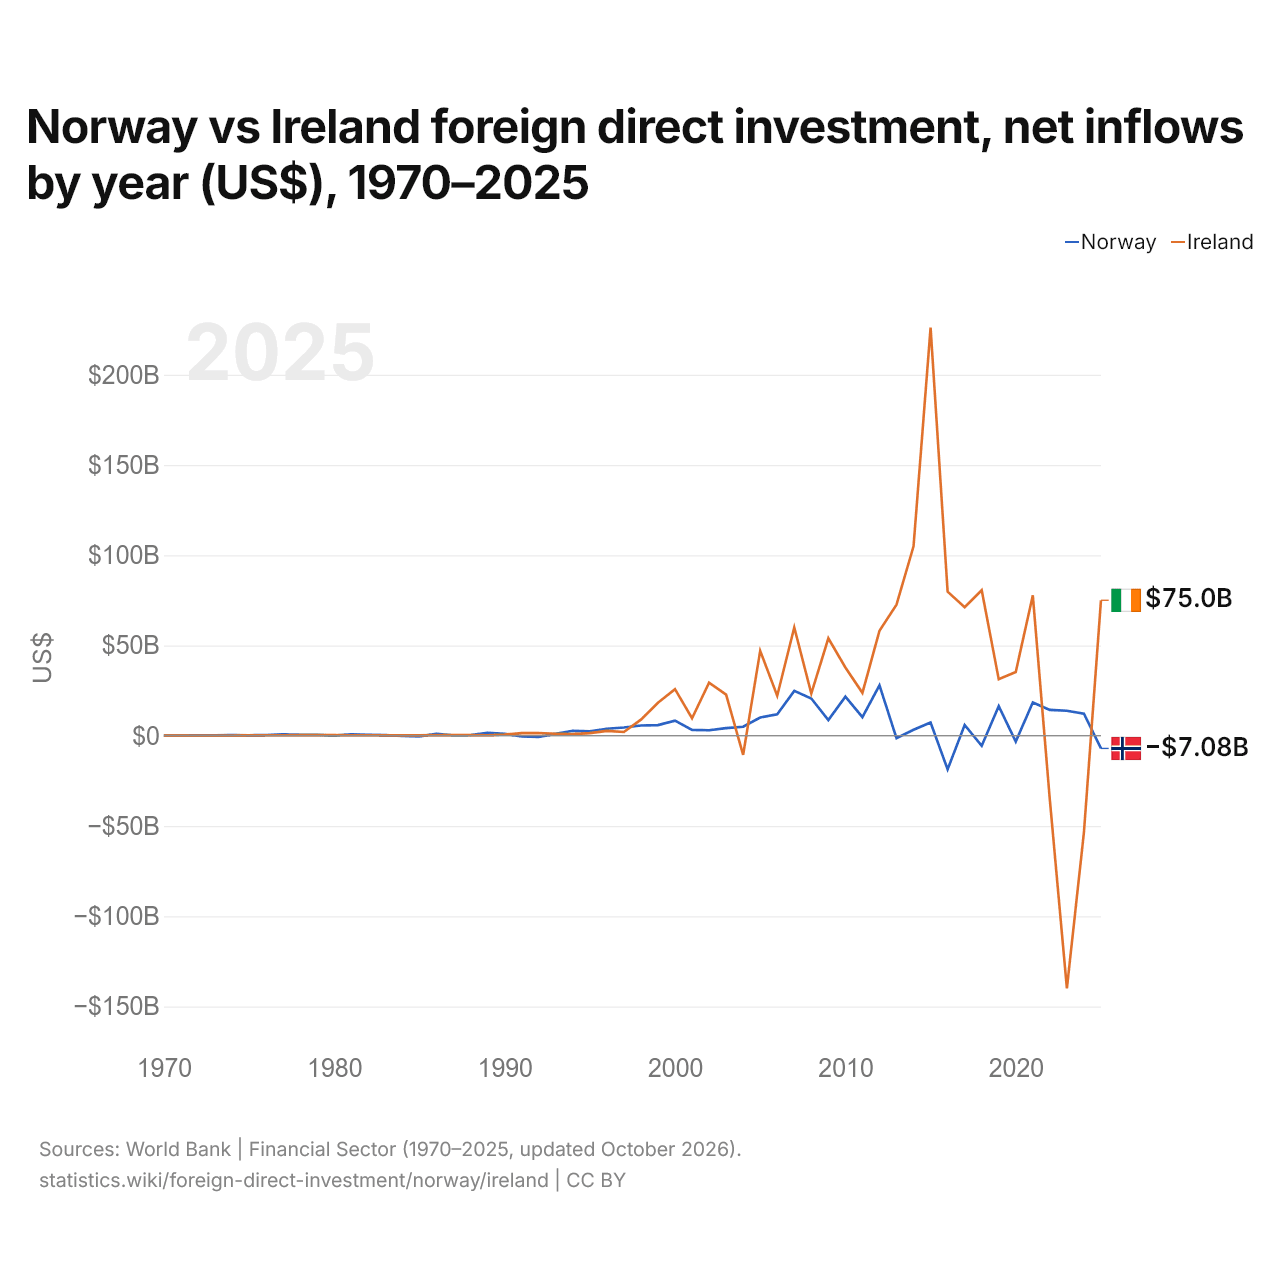
Norvège vs Irlande : investissements directs étrangers, entrées nettes par année ($ US), 1970–2025
| Année | $ US | |
|---|---|---|
 Norvège |
 Irlande |
|
| 2025 | −7 079 264 326 $ US | 74 999 719 124 $ US |
| 2024 | 12 133 906 455 $ US | −53 563 388 768 $ US |
| 2023 | 13 785 279 525 $ US | −139 972 323 560 $ US |
| 2022 | 14 278 134 699 $ US | −35 575 910 808 $ US |
| 2021 | 18 355 008 694 $ US | 77 722 796 051 $ US |
| 2020 | −3 281 320 957 $ US | 35 288 206 770 $ US |
| 2019 | 16 329 824 318 $ US | 31 252 184 929 $ US |
| 2018 | −5 664 319 362 $ US | 80 581 468 517 $ US |
| 2017 | 5 900 604 724 $ US | 71 124 020 352 $ US |
| 2016 | −18 668 572 814 $ US | 79 795 011 378 $ US |
| 2015 | 7 274 086 872 $ US | 226 022 972 770 $ US |
| 2014 | 3 242 240 088 $ US | 104 903 896 348 $ US |
| 2013 | −1 368 607 171 $ US | 72 540 330 764 $ US |
| 2012 | 27 897 968 328 $ US | 58 090 414 123 $ US |
| 2011 | 10 296 323 076 $ US | 23 699 352 433 $ US |
| 2010 | 21 634 265 663 $ US | 37 748 455 284 $ US |
| 2009 | 8 635 762 892 $ US | 53 974 309 647 $ US |
| 2008 | 20 578 219 685 $ US | 23 287 686 336 $ US |
| 2007 | 24 806 091 103 $ US | 59 934 755 383 $ US |
| 2006 | 11 877 923 790 $ US | 22 070 063 905 $ US |
| 2005 | 10 058 759 830 $ US | 47 001 243 614 $ US |
| 2004 | 4 918 494 986 $ US | −10 607 612 697 $ US |
| 2003 | 4 179 380 423 $ US | 22 781 292 817 $ US |
| 2002 | 3 011 752 930 $ US | 29 323 796 527 $ US |
| 2001 | 3 190 216 069 $ US | 9 650 920 350 $ US |
| 2000 | 8 332 062 186 $ US | 25 779 436 153 $ US |
| 1999 | 5 822 113 546 $ US | 18 210 641 714 $ US |
| 1998 | 5 645 870 321 $ US | 8 862 216 911 $ US |
| 1997 | 4 514 609 380 $ US | 2 028 797 815 $ US |
| 1996 | 3 827 495 491 $ US | 2 617 483 000 $ US |
| 1995 | 2 392 766 980 $ US | 1 442 925 000 $ US |
| 1994 | 2 736 393 920 $ US | 856 979 000 $ US |
| 1993 | 991 524 095 $ US | 1 077 890 000 $ US |
| 1992 | −668 114 803 $ US | 1 458 175 000 $ US |
| 1991 | −353 675 744 $ US | 1 361 668 000 $ US |
| 1990 | 1 001 987 072 $ US | 621 911 000 $ US |
| 1989 | 1 510 287 425 $ US | 192 759 336 $ US |
| 1988 | 280 910 587 $ US | 257 438 683 $ US |
| 1987 | 190 047 506 $ US | 322 476 620 $ US |
| 1986 | 1 018 718 112 $ US | 250 293 355 $ US |
| 1985 | −424 225 257 $ US | 163 660 000 $ US |
| 1984 | −177 399 976 $ US | 121 360 000 $ US |
| 1983 | 332 396 808 $ US | 169 650 000 $ US |
| 1982 | 450 026 120 $ US | 242 010 000 $ US |
| 1981 | 668 006 461 $ US | 203 450 000 $ US |
| 1980 | 59 815 998 $ US | 286 450 000 $ US |
| 1979 | 401 356 278 $ US | 336 680 000 $ US |
| 1978 | 489 814 168 $ US | 375 260 000 $ US |
| 1977 | 768 296 210 $ US | 136 240 000 $ US |
| 1976 | 371 391 272 $ US | 172 680 000 $ US |
| 1975 | 219 677 310 $ US | 158 170 000 $ US |
| 1974 | 346 000 000 $ US | 51 200 000 $ US |
| 1973 | 209 000 000 $ US | 52 000 000 $ US |
| 1972 | 121 000 000 $ US | 31 000 000 $ US |
| 1971 | 94 000 000 $ US | 25 000 000 $ US |
| 1970 | 64 000 000 $ US | 32 000 000 $ US |
En 2025, les entrées nettes d'investissements directs étrangers étaient négatives en Norvège, 7,08 milliards de dollars et de 75 milliards de dollars en Irlande. En 1970, elles étaient de 64 millions de dollars en Norvège et de 32 millions de dollars en Irlande.
Les entrées nettes d'investissements directs étrangers en Norvège ont été supérieures à celles de l'Irlande pendant 25 des 56 années de 1970 à 2025, et inférieures pendant 31.
Norvège vs Irlande : dernières entrées et sorties d'investissements étrangers
|
Norvège
|
Irlande
|
|
|---|---|---|
| Entrées nettes | −7,08 Md $US | +75,0 Md $US |
| Entrées nettes, % du PIB | −1,3 % | +10,4 % |
| Sorties nettes | +3,37 Md $US | +86,4 Md $US |
| Entrées nettes, total 2016–2025 | +46,1 Md $US | +222 Md $US |
| Rang mondial | 187/192 | 6/192 |
Comparer les investissements directs étrangers de 2 pays au choix
Sources :
- Banque mondiale | Secteur financier (1970–2025, mis à jour en octobre 2026)
Creative Commons Attribution (CC BY) : vous pouvez copier, partager, adapter et réutiliser ce contenu, y compris à des fins commerciales, à condition de citer statistics.wiki et d’indiquer les modifications apportées. Les sources citées ci-dessus peuvent avoir leurs propres conditions de licence.