
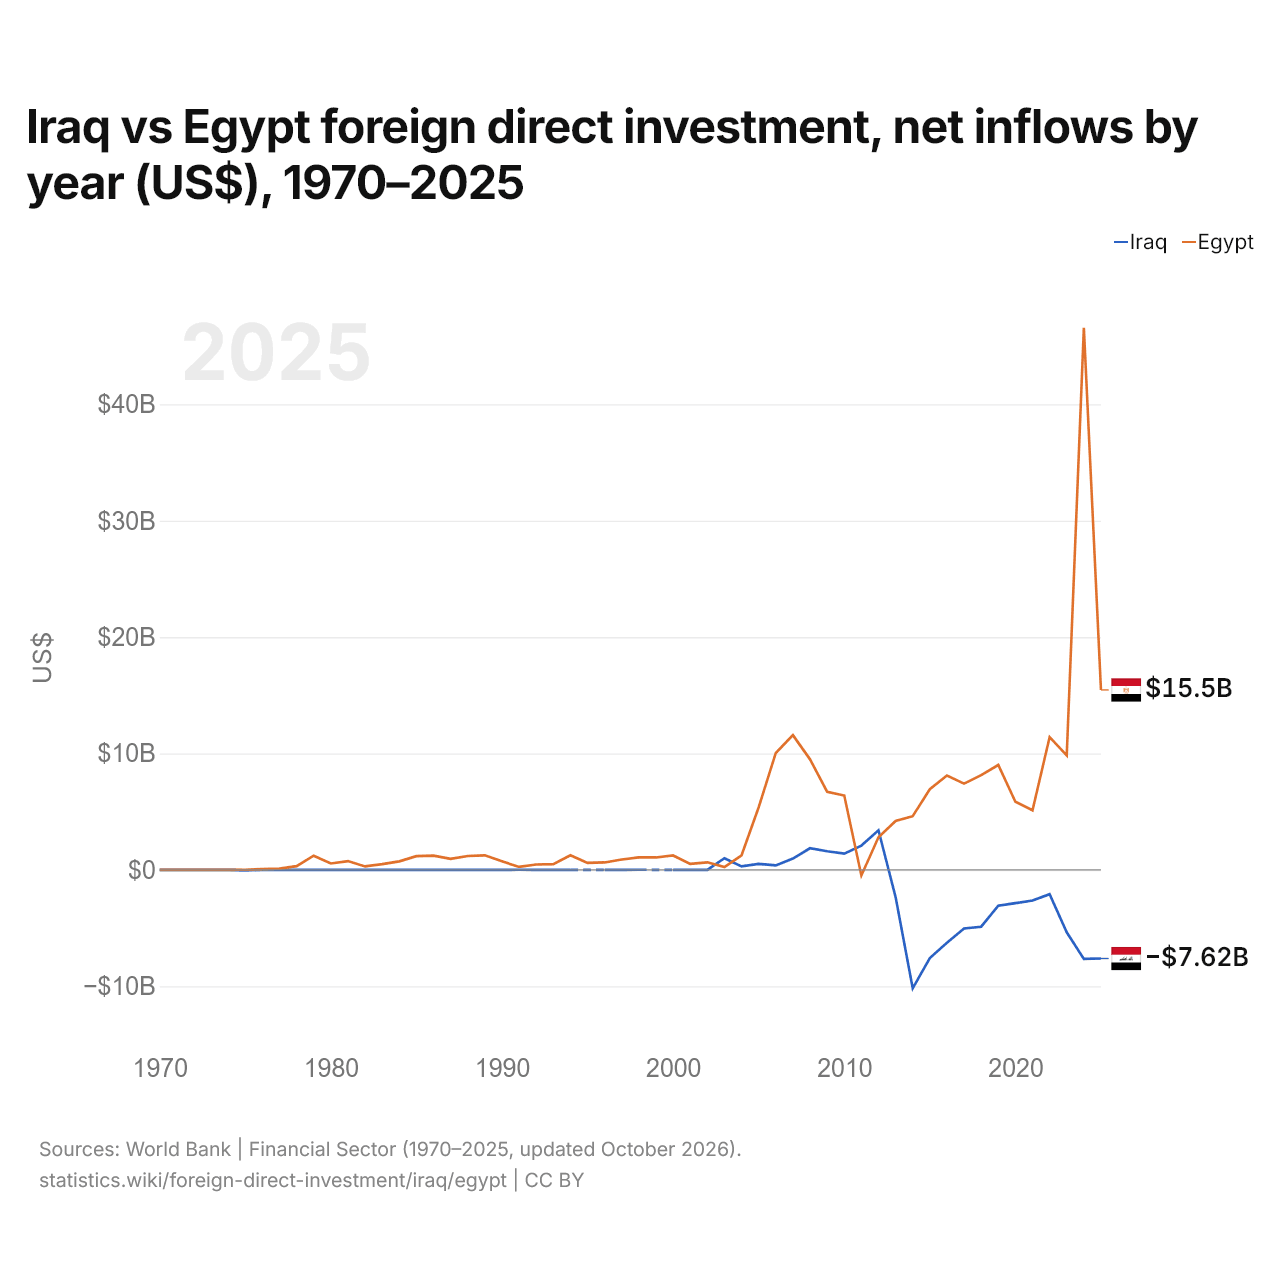
Irak vs Égypte : investissements directs étrangers, entrées nettes par année ($ US), 1970–2025
| Année | $ US | |
|---|---|---|
 Irak |
 Égypte |
|
| 2025 | −7 618 200 000 $ US | 15 452 700 000 $ US |
| 2024 | −7 648 900 000 $ US | 46 578 000 000 $ US |
| 2023 | −5 363 500 000 $ US | 9 840 600 000 $ US |
| 2022 | −2 088 200 000 $ US | 11 399 900 000 $ US |
| 2021 | −2 637 300 000 $ US | 5 122 300 000 $ US |
| 2020 | −2 859 100 000 $ US | 5 851 800 000 $ US |
| 2019 | −3 075 600 000 $ US | 9 010 100 000 $ US |
| 2018 | −4 885 100 000 $ US | 8 141 300 000 $ US |
| 2017 | −5 032 400 000 $ US | 7 408 700 000 $ US |
| 2016 | −6 255 900 000 $ US | 8 106 800 000 $ US |
| 2015 | −7 574 200 000 $ US | 6 925 200 000 $ US |
| 2014 | −10 176 400 000 $ US | 4 612 200 000 $ US |
| 2013 | −2 335 300 000 $ US | 4 192 200 000 $ US |
| 2012 | 3 400 000 000 $ US | 2 797 700 000 $ US |
| 2011 | 2 082 000 000 $ US | −482 700 000 $ US |
| 2010 | 1 396 200 000 $ US | 6 385 600 000 $ US |
| 2009 | 1 598 300 000 $ US | 6 711 600 000 $ US |
| 2008 | 1 855 700 000 $ US | 9 494 600 000 $ US |
| 2007 | 971 800 000 $ US | 11 578 100 000 $ US |
| 2006 | 383 000 000 $ US | 10 042 800 000 $ US |
| 2005 | 515 300 000 $ US | 5 375 600 000 $ US |
| 2004 | 300 000 000 $ US | 1 253 300 000 $ US |
| 2003 | 1 000 000 000 $ US | 237 400 000 $ US |
| 2002 | −326 000 $ US | 646 900 000 $ US |
| 2001 | −6 656 000 $ US | 509 900 000 $ US |
| 2000 | −32 000 $ US | 1 235 000 000 $ US |
| 1999 | - | 1 065 300 000 $ US |
| 1998 | 7 388 000 $ US | 1 076 000 000 $ US |
| 1997 | 1 153 000 $ US | 890 550 000 $ US |
| 1996 | −1 994 000 $ US | 636 000 000 $ US |
| 1995 | - | 598 000 000 $ US |
| 1994 | −30 000 $ US | 1 256 000 000 $ US |
| 1993 | 803 000 $ US | 493 000 000 $ US |
| 1992 | 93 000 $ US | 459 000 000 $ US |
| 1991 | 7 686 000 $ US | 253 000 000 $ US |
| 1990 | −6 810 000 $ US | 734 000 000 $ US |
| 1989 | 390 000 $ US | 1 250 181 818 $ US |
| 1988 | −3 383 000 $ US | 1 190 000 000 $ US |
| 1987 | −4 291 000 $ US | 947 714 286 $ US |
| 1986 | 918 000 $ US | 1 217 428 571 $ US |
| 1985 | −1 160 000 $ US | 1 177 571 429 $ US |
| 1984 | −2 749 000 $ US | 729 142 858 $ US |
| 1983 | −234 000 $ US | 490 000 001 $ US |
| 1982 | 2 420 000 $ US | 293 571 429 $ US |
| 1981 | 4 120 000 $ US | 752 571 430 $ US |
| 1980 | 1 530 000 $ US | 548 285 715 $ US |
| 1979 | 1 610 000 $ US | 1 216 285 716 $ US |
| 1978 | 300 000 $ US | 318 166 137 $ US |
| 1977 | 4 390 000 $ US | 104 777 603 $ US |
| 1976 | 1 350 000 $ US | 61 000 000 $ US |
| 1975 | −44 920 000 $ US | 8 000 000 $ US |
| 1974 | −8 830 000 $ US | 130 000 $ US |
| 1973 | −6 550 000 $ US | 700 000 $ US |
| 1972 | −90 000 $ US | 30 000 $ US |
| 1971 | −180 000 $ US | 2 310 000 $ US |
| 1970 | −910 000 $ US | 680 000 $ US |
En 2025, les entrées nettes d'investissements directs étrangers étaient négatives en Irak, 7,62 milliards de dollars et de 15,5 milliards de dollars en Égypte. En 1970, elles étaient négatives en Irak, 910 000 dollars et de 680 000 dollars en Égypte.
Les entrées nettes d'investissements directs étrangers en Irak ont été supérieures à celles de l'Égypte pendant 3 des 54 années de 1970 à 2025 que les deux pays ont communiquées, et inférieures pendant 51.
Irak vs Égypte : dernières entrées et sorties d'investissements étrangers
|
Irak
|
Égypte
|
|
|---|---|---|
| Entrées nettes | −7,62 Md $US | +15,5 Md $US |
| Entrées nettes, % du PIB | −3,0 % | +4,2 % |
| Sorties nettes | +422 M $US | +696 M $US |
| Entrées nettes, total 2016–2025 | −47,5 Md $US | +127 Md $US |
| Rang mondial | 188/192 | 27/192 |
Comparer les investissements directs étrangers de 2 pays au choix
Sources :
- Banque mondiale | Secteur financier (1970–2025, mis à jour en octobre 2026)
Creative Commons Attribution (CC BY) : vous pouvez copier, partager, adapter et réutiliser ce contenu, y compris à des fins commerciales, à condition de citer statistics.wiki et d’indiquer les modifications apportées. Les sources citées ci-dessus peuvent avoir leurs propres conditions de licence.