
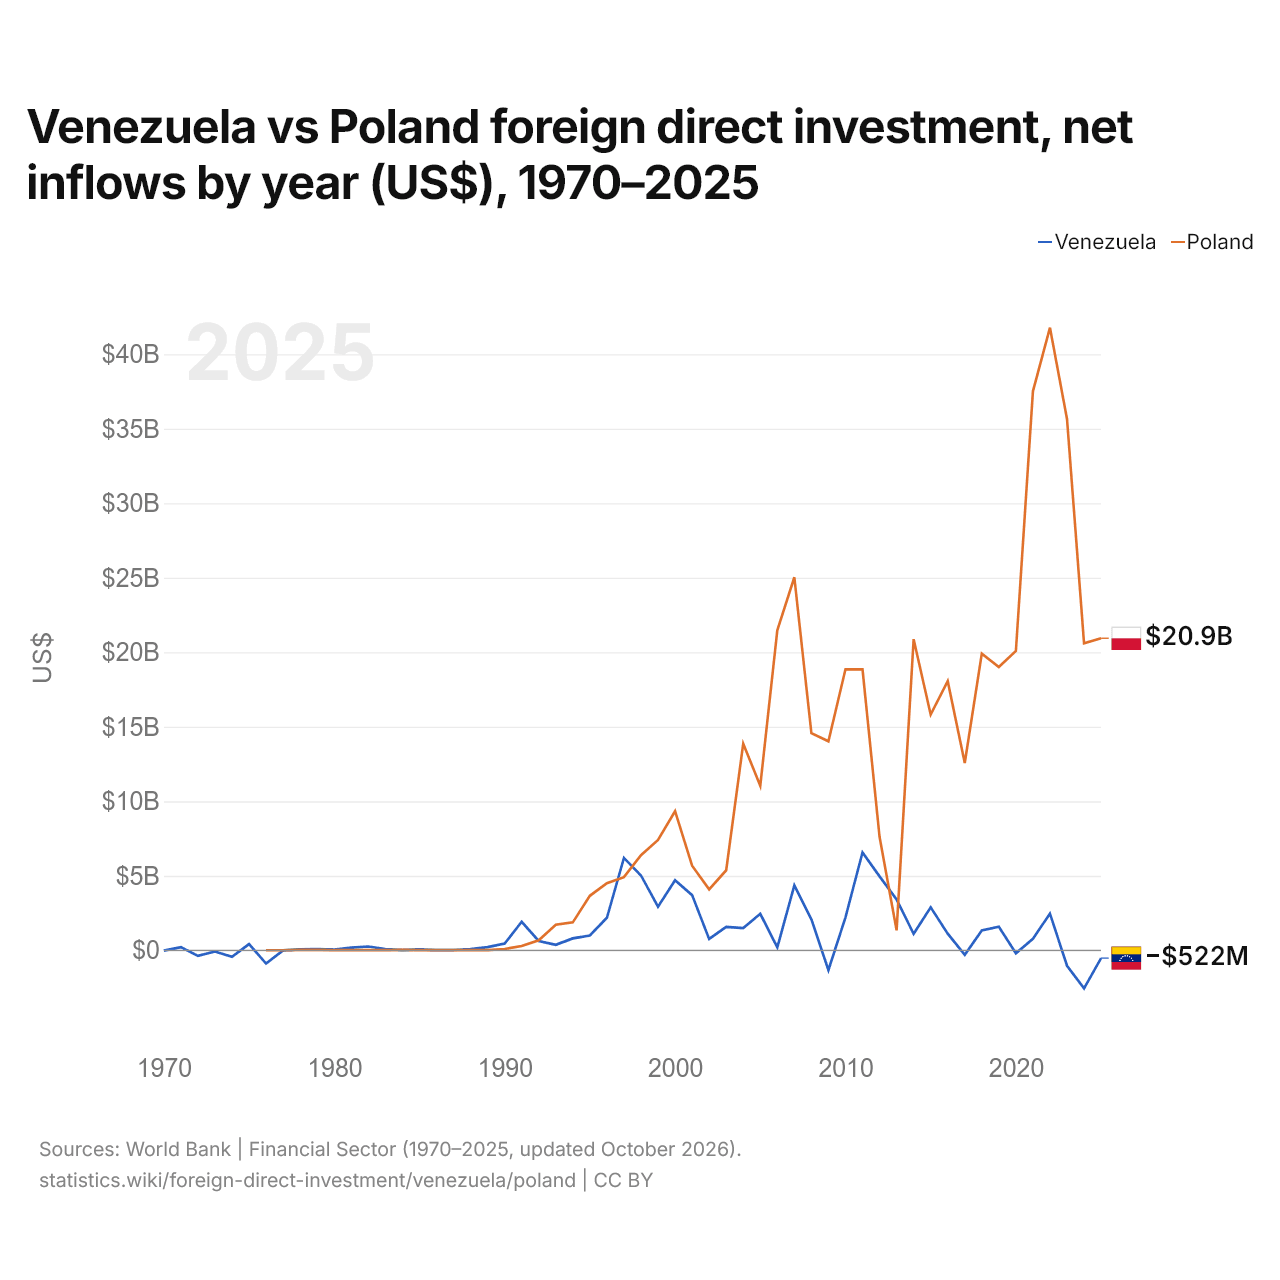
Venezuela vs Pologne : investissements directs étrangers, entrées nettes par année ($ US), 1970–2025
| Année | $ US | |
|---|---|---|
 Venezuela |
 Pologne |
|
| 2025 | −522 000 000 $ US | 20 940 000 000 $ US |
| 2024 | −2 549 000 000 $ US | 20 606 000 000 $ US |
| 2023 | −1 037 000 000 $ US | 35 660 000 000 $ US |
| 2022 | 2 465 000 000 $ US | 41 780 000 000 $ US |
| 2021 | 771 000 000 $ US | 37 512 000 000 $ US |
| 2020 | −198 000 000 $ US | 20 086 000 000 $ US |
| 2019 | 1 579 000 000 $ US | 19 012 000 000 $ US |
| 2018 | 1 337 000 000 $ US | 19 908 000 000 $ US |
| 2017 | −307 000 000 $ US | 12 565 000 000 $ US |
| 2016 | 1 113 000 000 $ US | 18 060 000 000 $ US |
| 2015 | 2 883 000 000 $ US | 15 820 000 000 $ US |
| 2014 | 1 110 000 000 $ US | 20 877 000 000 $ US |
| 2013 | 3 412 000 000 $ US | 1 342 000 000 $ US |
| 2012 | 4 961 000 000 $ US | 7 616 000 000 $ US |
| 2011 | 6 571 000 000 $ US | 18 851 000 000 $ US |
| 2010 | 2 211 000 000 $ US | 18 861 000 000 $ US |
| 2009 | −1 323 000 000 $ US | 14 025 000 000 $ US |
| 2008 | 2 083 000 000 $ US | 14 574 000 000 $ US |
| 2007 | 4 358 000 000 $ US | 25 031 000 000 $ US |
| 2006 | 198 000 000 $ US | 21 473 000 000 $ US |
| 2005 | 2 450 000 000 $ US | 11 041 000 000 $ US |
| 2004 | 1 489 000 000 $ US | 13 868 000 000 $ US |
| 2003 | 1 573 000 000 $ US | 5 371 000 000 $ US |
| 2002 | 761 000 000 $ US | 4 091 000 000 $ US |
| 2001 | 3 704 000 000 $ US | 5 677 000 000 $ US |
| 2000 | 4 703 000 000 $ US | 9 335 000 000 $ US |
| 1999 | 2 932 000 000 $ US | 7 407 000 000 $ US |
| 1998 | 5 024 000 000 $ US | 6 383 000 000 $ US |
| 1997 | 6 202 000 000 $ US | 4 910 000 000 $ US |
| 1996 | 2 183 000 000 $ US | 4 500 000 000 $ US |
| 1995 | 996 000 000 $ US | 3 659 000 000 $ US |
| 1994 | 801 000 000 $ US | 1 875 000 000 $ US |
| 1993 | 372 000 000 $ US | 1 715 000 000 $ US |
| 1992 | 629 000 000 $ US | 678 000 000 $ US |
| 1991 | 1 916 000 000 $ US | 291 000 000 $ US |
| 1990 | 451 000 000 $ US | 89 000 000 $ US |
| 1989 | 213 000 000 $ US | 11 000 000 $ US |
| 1988 | 89 000 000 $ US | 15 000 000 $ US |
| 1987 | 21 000 000 $ US | 12 000 000 $ US |
| 1986 | 16 000 000 $ US | 16 000 000 $ US |
| 1985 | 68 000 000 $ US | 15 000 000 $ US |
| 1984 | 18 000 000 $ US | 28 000 000 $ US |
| 1983 | 86 000 000 $ US | 16 000 000 $ US |
| 1982 | 257 000 000 $ US | 14 000 000 $ US |
| 1981 | 184 000 000 $ US | 18 000 000 $ US |
| 1980 | 55 000 000 $ US | 10 000 000 $ US |
| 1979 | 88 000 000 $ US | 30 000 000 $ US |
| 1978 | 67 000 000 $ US | 25 000 000 $ US |
| 1977 | −3 000 000 $ US | 5 000 000 $ US |
| 1976 | −889 000 000 $ US | 6 000 000 $ US |
| 1975 | 418 000 000 $ US | - |
| 1974 | −430 000 000 $ US | - |
| 1973 | −84 000 000 $ US | - |
| 1972 | −376 000 000 $ US | - |
| 1971 | 211 000 000 $ US | - |
| 1970 | −23 000 000 $ US | - |
En 2025, les entrées nettes d'investissements directs étrangers étaient négatives au Venezuela, 522 millions de dollars et de 20,9 milliards de dollars en Pologne. En 1976, elles étaient négatives au Venezuela, 889 millions de dollars et de 6 millions de dollars en Pologne.
Les entrées nettes d'investissements directs étrangers au Venezuela ont été supérieures à celles de la Pologne pendant 14 des 50 années de 1976 à 2025, et inférieures pendant 35.
Venezuela vs Pologne : dernières entrées et sorties d'investissements étrangers
|
Venezuela
|
Pologne
|
|
|---|---|---|
| Entrées nettes | −522 M $US | +20,9 Md $US |
| Entrées nettes, % du PIB | −0,5 % | +2,0 % |
| Sorties nettes | +277 M $US | +8,24 Md $US |
| Entrées nettes, total 2016–2025 | +2,65 Md $US | +246 Md $US |
| Rang mondial | 179/192 | 22/192 |
Comparer les investissements directs étrangers de 2 pays au choix
Sources :
- Banque mondiale | Secteur financier (1970–2025, mis à jour en octobre 2026)
Creative Commons Attribution (CC BY) : vous pouvez copier, partager, adapter et réutiliser ce contenu, y compris à des fins commerciales, à condition de citer statistics.wiki et d’indiquer les modifications apportées. Les sources citées ci-dessus peuvent avoir leurs propres conditions de licence.