
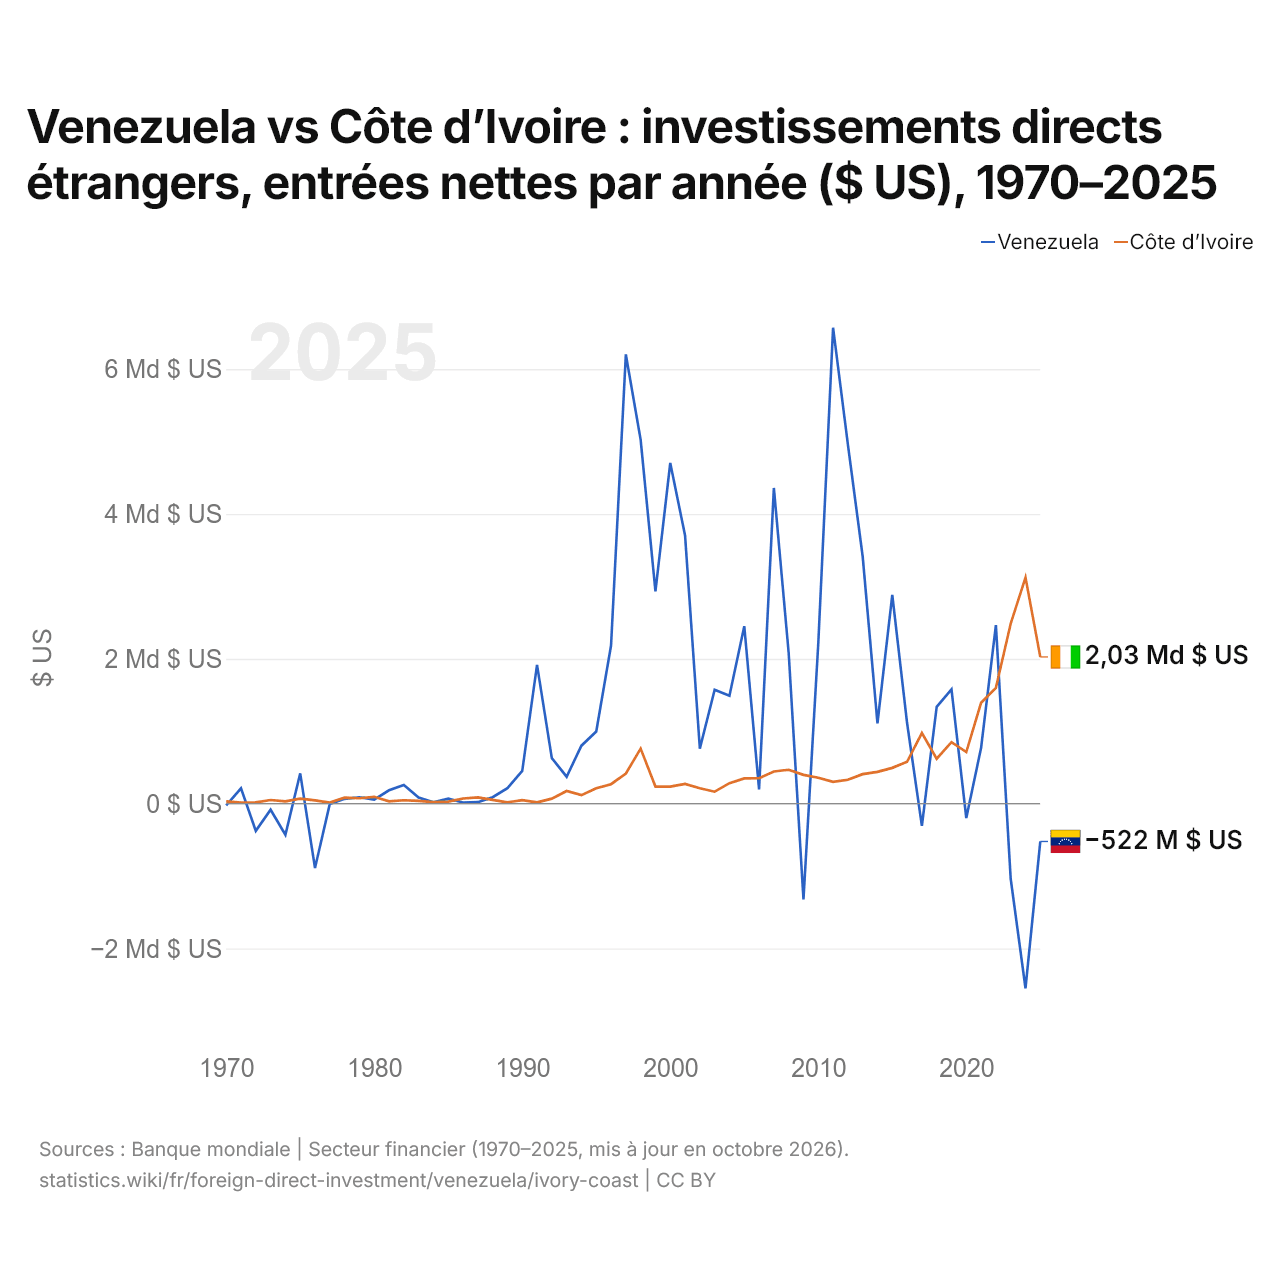
Venezuela vs Côte d’Ivoire : investissements directs étrangers, entrées nettes par année ($ US), 1970–2025
| Année | $ US | |
|---|---|---|
 Venezuela |
 Côte d’Ivoire |
|
| 2025 | −522 000 000 $ US | 2 025 517 355 $ US |
| 2024 | −2 549 000 000 $ US | 3 121 671 773 $ US |
| 2023 | −1 037 000 000 $ US | 2 485 137 117 $ US |
| 2022 | 2 465 000 000 $ US | 1 599 115 749 $ US |
| 2021 | 771 000 000 $ US | 1 392 435 143 $ US |
| 2020 | −198 000 000 $ US | 712 915 894 $ US |
| 2019 | 1 579 000 000 $ US | 848 881 139 $ US |
| 2018 | 1 337 000 000 $ US | 620 330 654 $ US |
| 2017 | −307 000 000 $ US | 975 014 999 $ US |
| 2016 | 1 113 000 000 $ US | 577 871 524 $ US |
| 2015 | 2 883 000 000 $ US | 494 408 756 $ US |
| 2014 | 1 110 000 000 $ US | 439 356 961 $ US |
| 2013 | 3 412 000 000 $ US | 407 592 122 $ US |
| 2012 | 4 961 000 000 $ US | 330 255 521 $ US |
| 2011 | 6 571 000 000 $ US | 301 972 463 $ US |
| 2010 | 2 211 000 000 $ US | 358 468 317 $ US |
| 2009 | −1 323 000 000 $ US | 397 624 744 $ US |
| 2008 | 2 083 000 000 $ US | 468 377 744 $ US |
| 2007 | 4 358 000 000 $ US | 443 801 751 $ US |
| 2006 | 198 000 000 $ US | 350 964 619 $ US |
| 2005 | 2 450 000 000 $ US | 349 059 587 $ US |
| 2004 | 1 489 000 000 $ US | 282 979 831 $ US |
| 2003 | 1 573 000 000 $ US | 165 390 571 $ US |
| 2002 | 761 000 000 $ US | 212 580 417 $ US |
| 2001 | 3 704 000 000 $ US | 272 679 898 $ US |
| 2000 | 4 703 000 000 $ US | 234 701 732 $ US |
| 1999 | 2 932 000 000 $ US | 235 348 766 $ US |
| 1998 | 5 024 000 000 $ US | 760 099 127 $ US |
| 1997 | 6 202 000 000 $ US | 415 458 076 $ US |
| 1996 | 2 183 000 000 $ US | 269 194 530 $ US |
| 1995 | 996 000 000 $ US | 211 760 840 $ US |
| 1994 | 801 000 000 $ US | 117 538 567 $ US |
| 1993 | 372 000 000 $ US | 175 153 533 $ US |
| 1992 | 629 000 000 $ US | 69 053 844 $ US |
| 1991 | 1 916 000 000 $ US | 18 524 886 $ US |
| 1990 | 451 000 000 $ US | 48 434 430 $ US |
| 1989 | 213 000 000 $ US | 18 490 000 $ US |
| 1988 | 89 000 000 $ US | 51 700 000 $ US |
| 1987 | 21 000 000 $ US | 87 510 000 $ US |
| 1986 | 16 000 000 $ US | 70 750 000 $ US |
| 1985 | 68 000 000 $ US | 29 160 000 $ US |
| 1984 | 18 000 000 $ US | 21 740 000 $ US |
| 1983 | 86 000 000 $ US | 37 530 000 $ US |
| 1982 | 257 000 000 $ US | 47 470 000 $ US |
| 1981 | 184 000 000 $ US | 32 750 000 $ US |
| 1980 | 55 000 000 $ US | 94 660 000 $ US |
| 1979 | 88 000 000 $ US | 74 750 000 $ US |
| 1978 | 67 000 000 $ US | 83 310 000 $ US |
| 1977 | −3 000 000 $ US | 14 650 000 $ US |
| 1976 | −889 000 000 $ US | 44 780 000 $ US |
| 1975 | 418 000 000 $ US | 69 060 000 $ US |
| 1974 | −430 000 000 $ US | 32 600 000 $ US |
| 1973 | −84 000 000 $ US | 51 000 000 $ US |
| 1972 | −376 000 000 $ US | 18 700 000 $ US |
| 1971 | 211 000 000 $ US | 15 700 000 $ US |
| 1970 | −23 000 000 $ US | 30 700 000 $ US |
En 2025, les entrées nettes d'investissements directs étrangers étaient négatives au Venezuela, 522 millions de dollars et de 2,03 milliards de dollars en Côte d’Ivoire. En 1970, elles étaient négatives au Venezuela, 23 millions de dollars et de 30,7 millions de dollars en Côte d’Ivoire.
Les entrées nettes d'investissements directs étrangers au Venezuela ont été supérieures à celles de la Côte d’Ivoire pendant 37 des 56 années de 1970 à 2025, et inférieures pendant 19.
Venezuela vs Côte d’Ivoire : dernières entrées et sorties d'investissements étrangers
|
Venezuela
|
Côte d’Ivoire
|
|
|---|---|---|
| Entrées nettes | −522 M $US | +2,03 Md $US |
| Entrées nettes, % du PIB | −0,5 % | +2,0 % |
| Sorties nettes | +277 M $US | +362 M $US |
| Entrées nettes, total 2016–2025 | +2,65 Md $US | +14,4 Md $US |
| Rang mondial | 179/192 | 65/192 |
Comparer les investissements directs étrangers de 2 pays au choix
Sources :
- Banque mondiale | Secteur financier (1970–2025, mis à jour en octobre 2026)
Creative Commons Attribution (CC BY) : vous pouvez copier, partager, adapter et réutiliser ce contenu, y compris à des fins commerciales, à condition de citer statistics.wiki et d’indiquer les modifications apportées. Les sources citées ci-dessus peuvent avoir leurs propres conditions de licence.