
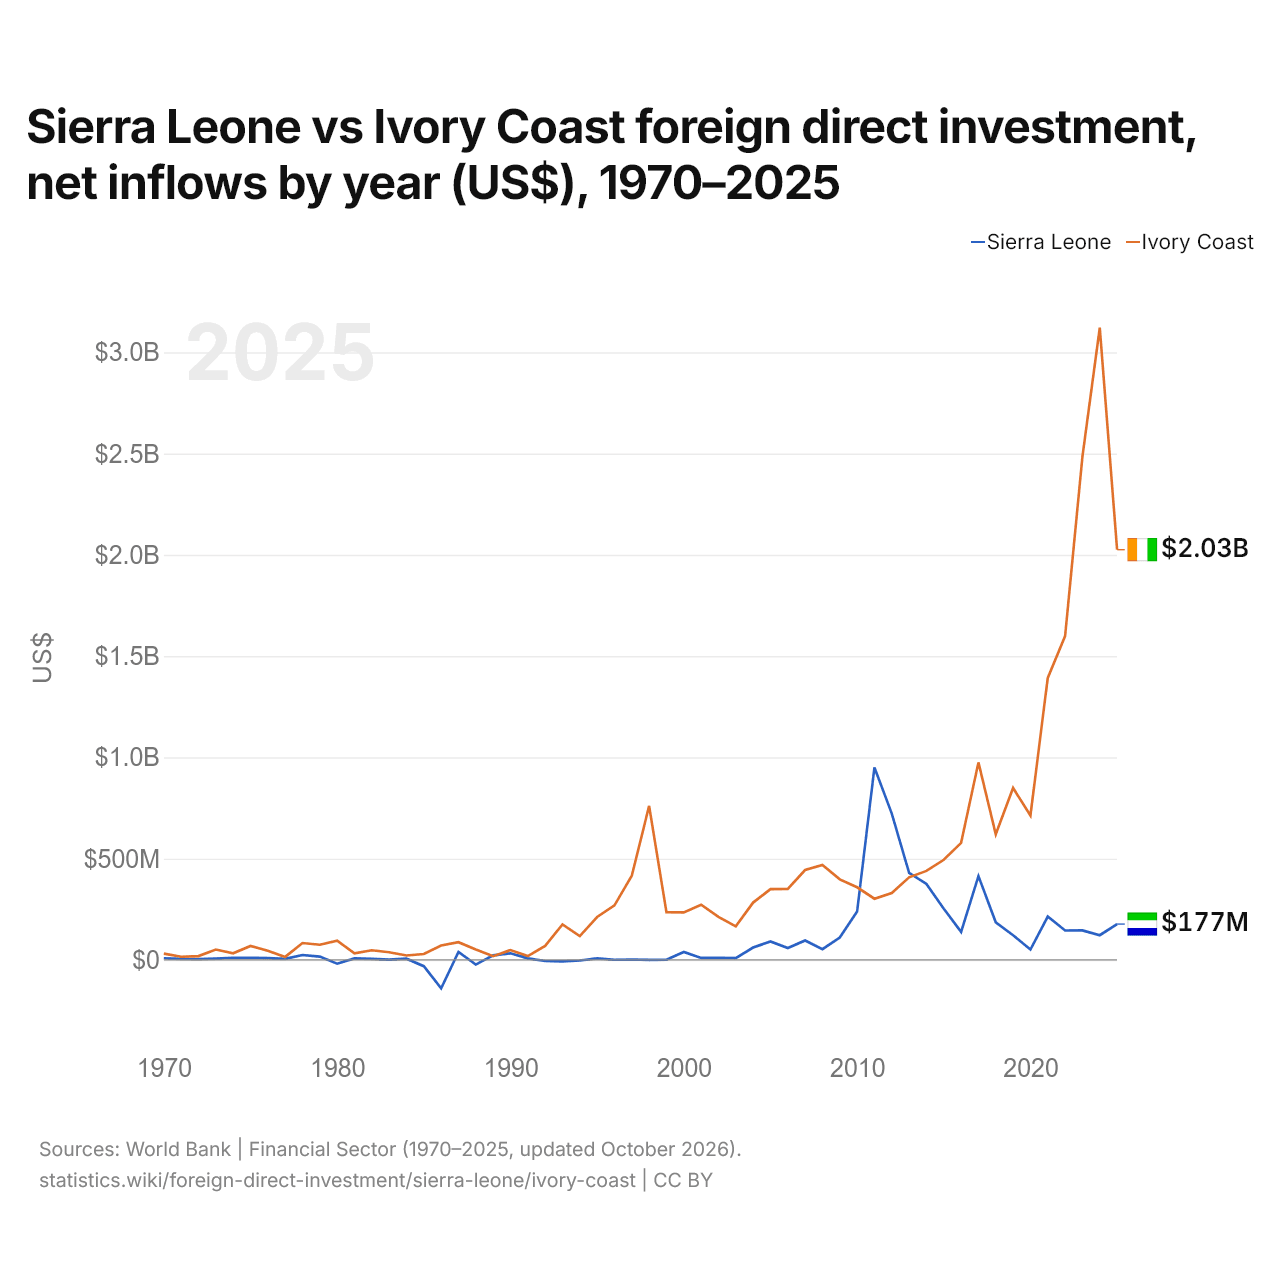
Sierra Leone vs Côte d’Ivoire : investissements directs étrangers, entrées nettes par année ($ US), 1970–2025
| Année | $ US | |
|---|---|---|
 Sierra Leone |
 Côte d’Ivoire |
|
| 2025 | 177 041 499 $ US | 2 025 517 355 $ US |
| 2024 | 121 785 334 $ US | 3 121 671 773 $ US |
| 2023 | 145 910 238 $ US | 2 485 137 117 $ US |
| 2022 | 145 000 000 $ US | 1 599 115 749 $ US |
| 2021 | 214 000 000 $ US | 1 392 435 143 $ US |
| 2020 | 51 000 000 $ US | 712 915 894 $ US |
| 2019 | 121 782 194 $ US | 848 881 139 $ US |
| 2018 | 185 646 292 $ US | 620 330 654 $ US |
| 2017 | 413 724 601 $ US | 975 014 999 $ US |
| 2016 | 138 517 340 $ US | 577 871 524 $ US |
| 2015 | 252 435 829 $ US | 494 408 756 $ US |
| 2014 | 375 089 629 $ US | 439 356 961 $ US |
| 2013 | 429 664 580 $ US | 407 592 122 $ US |
| 2012 | 722 447 405 $ US | 330 255 521 $ US |
| 2011 | 950 477 791 $ US | 301 972 463 $ US |
| 2010 | 238 404 209 $ US | 358 468 317 $ US |
| 2009 | 110 430 203 $ US | 397 624 744 $ US |
| 2008 | 53 095 068 $ US | 468 377 744 $ US |
| 2007 | 95 470 171 $ US | 443 801 751 $ US |
| 2006 | 58 869 144 $ US | 350 964 619 $ US |
| 2005 | 90 731 670 $ US | 349 059 587 $ US |
| 2004 | 61 153 314 $ US | 282 979 831 $ US |
| 2003 | 8 615 050 $ US | 165 390 571 $ US |
| 2002 | 10 413 409 $ US | 212 580 417 $ US |
| 2001 | 9 835 742 $ US | 272 679 898 $ US |
| 2000 | 39 000 825 $ US | 234 701 732 $ US |
| 1999 | 533 202 $ US | 235 348 766 $ US |
| 1998 | 104 885 $ US | 760 099 127 $ US |
| 1997 | 1 800 032 $ US | 415 458 076 $ US |
| 1996 | 663 928 $ US | 269 194 530 $ US |
| 1995 | 7 287 056 $ US | 211 760 840 $ US |
| 1994 | −2 874 188 $ US | 117 538 567 $ US |
| 1993 | −7 462 924 $ US | 175 153 533 $ US |
| 1992 | −5 599 050 $ US | 69 053 844 $ US |
| 1991 | 7 504 465 $ US | 18 524 886 $ US |
| 1990 | 32 434 699 $ US | 48 434 430 $ US |
| 1989 | 22 356 434 $ US | 18 490 000 $ US |
| 1988 | −23 088 457 $ US | 51 700 000 $ US |
| 1987 | 39 409 533 $ US | 87 510 000 $ US |
| 1986 | −140 310 794 $ US | 70 750 000 $ US |
| 1985 | −30 957 002 $ US | 29 160 000 $ US |
| 1984 | 5 856 690 $ US | 21 740 000 $ US |
| 1983 | 1 697 315 $ US | 37 530 000 $ US |
| 1982 | 4 682 516 $ US | 47 470 000 $ US |
| 1981 | 7 505 833 $ US | 32 750 000 $ US |
| 1980 | −18 670 265 $ US | 94 660 000 $ US |
| 1979 | 16 083 672 $ US | 74 750 000 $ US |
| 1978 | 24 258 786 $ US | 83 310 000 $ US |
| 1977 | 5 058 890 $ US | 14 650 000 $ US |
| 1976 | 8 500 000 $ US | 44 780 000 $ US |
| 1975 | 10 100 000 $ US | 69 060 000 $ US |
| 1974 | 10 500 000 $ US | 32 600 000 $ US |
| 1973 | 6 240 000 $ US | 51 000 000 $ US |
| 1972 | 3 800 000 $ US | 18 700 000 $ US |
| 1971 | 5 200 000 $ US | 15 700 000 $ US |
| 1970 | 8 200 000 $ US | 30 700 000 $ US |
En 2025, les entrées nettes d'investissements directs étrangers étaient de 177 millions de dollars en Sierra Leone et de 2,03 milliards de dollars en Côte d’Ivoire : 11 fois plus en Côte d’Ivoire. En 1970, elles étaient de 8,2 millions de dollars en Sierra Leone et de 30,7 millions de dollars en Côte d’Ivoire.
Les entrées nettes d'investissements directs étrangers en Sierra Leone ont été supérieures à celles de la Côte d’Ivoire pendant 4 des 56 années de 1970 à 2025, et inférieures pendant 52.
Sierra Leone vs Côte d’Ivoire : dernières entrées et sorties d'investissements étrangers
|
Sierra Leone
|
Côte d’Ivoire
|
|
|---|---|---|
| Entrées nettes | +177 M $US | +2,03 Md $US |
| Entrées nettes, % du PIB | +2,4 % | +2,0 % |
| Sorties nettes | n.d. | +362 M $US (2025) |
| Entrées nettes, total 2016–2025 | +1,71 Md $US | +14,4 Md $US |
| Rang mondial | 139/192 | 65/192 |
Comparer les investissements directs étrangers de 2 pays au choix
Sources :
- Banque mondiale | Secteur financier (1970–2025, mis à jour en octobre 2026)
Creative Commons Attribution (CC BY) : vous pouvez copier, partager, adapter et réutiliser ce contenu, y compris à des fins commerciales, à condition de citer statistics.wiki et d’indiquer les modifications apportées. Les sources citées ci-dessus peuvent avoir leurs propres conditions de licence.