
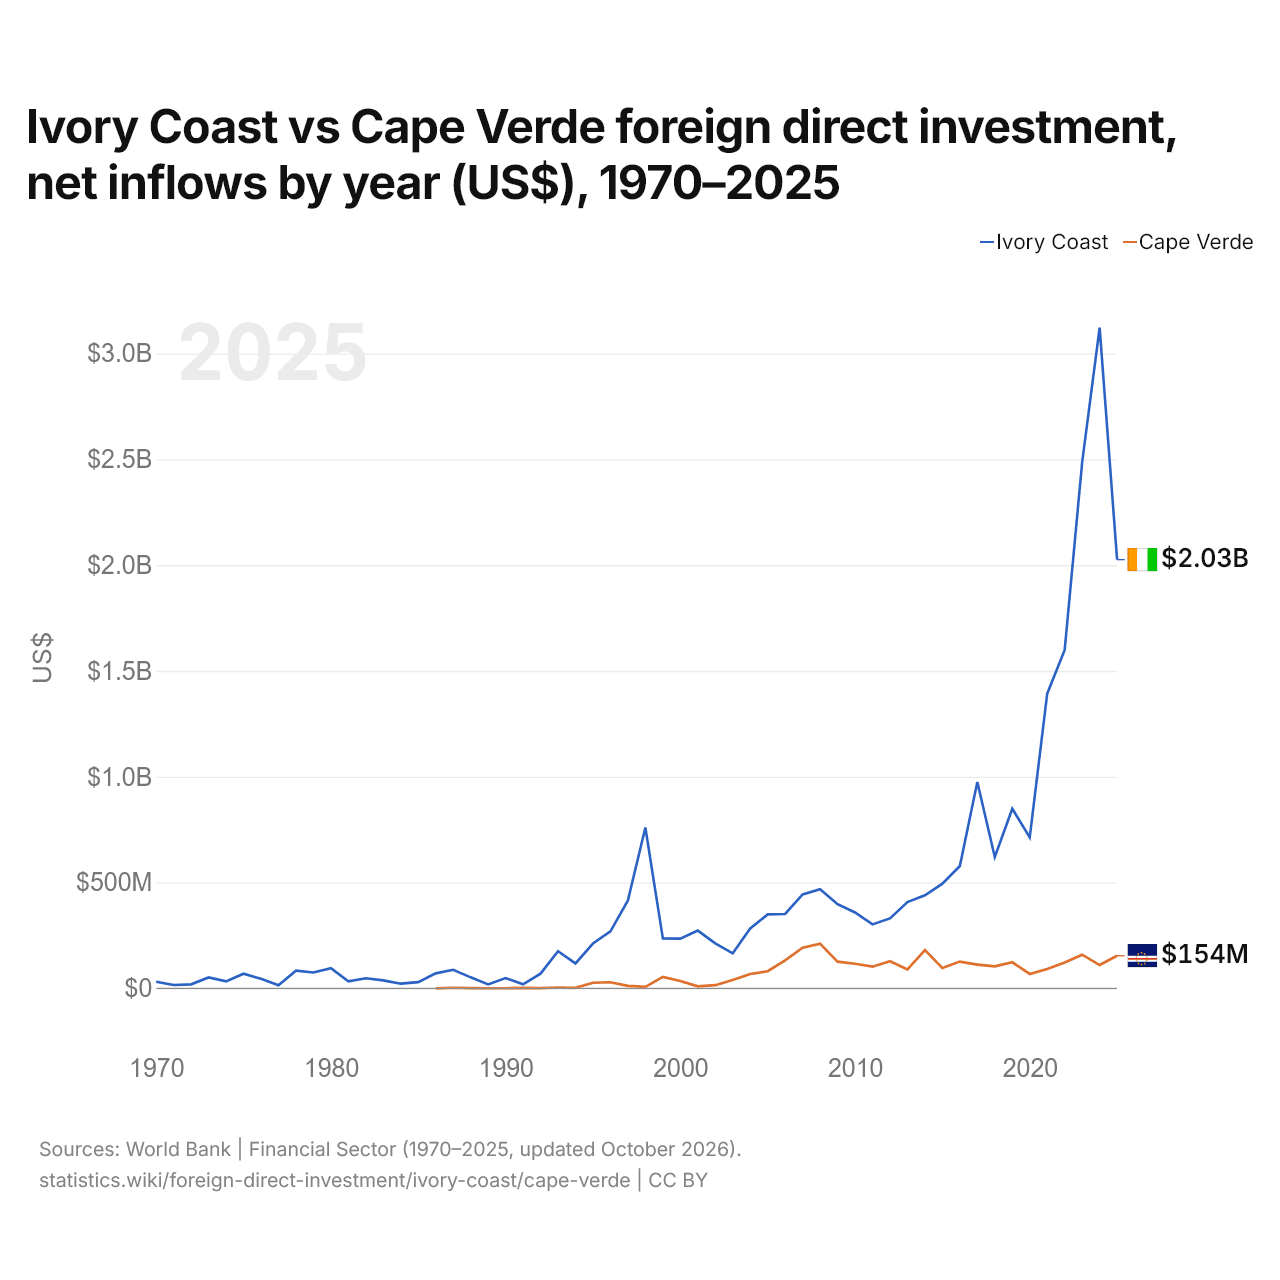
Côte d’Ivoire vs Cap-Vert : investissements directs étrangers, entrées nettes par année ($ US), 1970–2025
| Année | $ US | |
|---|---|---|
 Côte d’Ivoire |
 Cap-Vert |
|
| 2025 | 2 025 517 355 $ US | 153 852 100 $ US |
| 2024 | 3 121 671 773 $ US | 109 932 742 $ US |
| 2023 | 2 485 137 117 $ US | 158 735 895 $ US |
| 2022 | 1 599 115 749 $ US | 122 015 529 $ US |
| 2021 | 1 392 435 143 $ US | 91 456 883 $ US |
| 2020 | 712 915 894 $ US | 67 619 884 $ US |
| 2019 | 848 881 139 $ US | 122 921 295 $ US |
| 2018 | 620 330 654 $ US | 103 550 533 $ US |
| 2017 | 975 014 999 $ US | 111 711 634 $ US |
| 2016 | 577 871 524 $ US | 126 312 006 $ US |
| 2015 | 494 408 756 $ US | 96 071 473 $ US |
| 2014 | 439 356 961 $ US | 180 589 795 $ US |
| 2013 | 407 592 122 $ US | 89 297 444 $ US |
| 2012 | 330 255 521 $ US | 128 009 965 $ US |
| 2011 | 301 972 463 $ US | 102 246 382 $ US |
| 2010 | 358 468 317 $ US | 116 200 564 $ US |
| 2009 | 397 624 744 $ US | 126 003 552 $ US |
| 2008 | 468 377 744 $ US | 210 903 689 $ US |
| 2007 | 443 801 751 $ US | 191 764 359 $ US |
| 2006 | 350 964 619 $ US | 131 539 968 $ US |
| 2005 | 349 059 587 $ US | 80 513 541 $ US |
| 2004 | 282 979 831 $ US | 67 638 274 $ US |
| 2003 | 165 390 571 $ US | 39 216 511 $ US |
| 2002 | 212 580 417 $ US | 14 759 047 $ US |
| 2001 | 272 679 898 $ US | 9 010 186 $ US |
| 2000 | 234 701 732 $ US | 34 202 238 $ US |
| 1999 | 235 348 766 $ US | 53 935 025 $ US |
| 1998 | 760 099 127 $ US | 6 793 745 $ US |
| 1997 | 415 458 076 $ US | 11 576 611 $ US |
| 1996 | 269 194 530 $ US | 28 528 008 $ US |
| 1995 | 211 760 840 $ US | 26 180 647 $ US |
| 1994 | 117 538 567 $ US | 2 128 443 $ US |
| 1993 | 175 153 533 $ US | 3 644 068 $ US |
| 1992 | 69 053 844 $ US | 450 472 $ US |
| 1991 | 18 524 886 $ US | 1 744 334 $ US |
| 1990 | 48 434 430 $ US | 252 601 $ US |
| 1989 | 18 490 000 $ US | 174 023 $ US |
| 1988 | 51 700 000 $ US | 597 912 $ US |
| 1987 | 87 510 000 $ US | 2 786 141 $ US |
| 1986 | 70 750 000 $ US | −8 734 $ US |
| 1985 | 29 160 000 $ US | - |
| 1984 | 21 740 000 $ US | - |
| 1983 | 37 530 000 $ US | - |
| 1982 | 47 470 000 $ US | - |
| 1981 | 32 750 000 $ US | - |
| 1980 | 94 660 000 $ US | - |
| 1979 | 74 750 000 $ US | - |
| 1978 | 83 310 000 $ US | - |
| 1977 | 14 650 000 $ US | - |
| 1976 | 44 780 000 $ US | - |
| 1975 | 69 060 000 $ US | - |
| 1974 | 32 600 000 $ US | - |
| 1973 | 51 000 000 $ US | - |
| 1972 | 18 700 000 $ US | - |
| 1971 | 15 700 000 $ US | - |
| 1970 | 30 700 000 $ US | - |
En 2025, les entrées nettes d'investissements directs étrangers étaient de 2,03 milliards de dollars en Côte d’Ivoire et de 154 millions de dollars au Cap-Vert : 13 fois plus en Côte d’Ivoire. En 1986, elles étaient de 70,8 millions de dollars en Côte d’Ivoire et négatives au Cap-Vert, 8 730 dollars.
Les entrées nettes d'investissements directs étrangers en Côte d’Ivoire ont été supérieures à celles du Cap-Vert chacune des 40 années de 1986 à 2025.
Côte d’Ivoire vs Cap-Vert : dernières entrées et sorties d'investissements étrangers
|
Côte d’Ivoire
|
Cap-Vert
|
|
|---|---|---|
| Entrées nettes | +2,03 Md $US | +154 M $US |
| Entrées nettes, % du PIB | +2,0 % | +5,0 % |
| Sorties nettes | +362 M $US | +25,7 M $US |
| Entrées nettes, total 2016–2025 | +14,4 Md $US | +1,17 Md $US |
| Rang mondial | 65/192 | 141/192 |
Comparer les investissements directs étrangers de 2 pays au choix
Sources :
- Banque mondiale | Secteur financier (1970–2025, mis à jour en octobre 2026)
Creative Commons Attribution (CC BY) : vous pouvez copier, partager, adapter et réutiliser ce contenu, y compris à des fins commerciales, à condition de citer statistics.wiki et d’indiquer les modifications apportées. Les sources citées ci-dessus peuvent avoir leurs propres conditions de licence.