
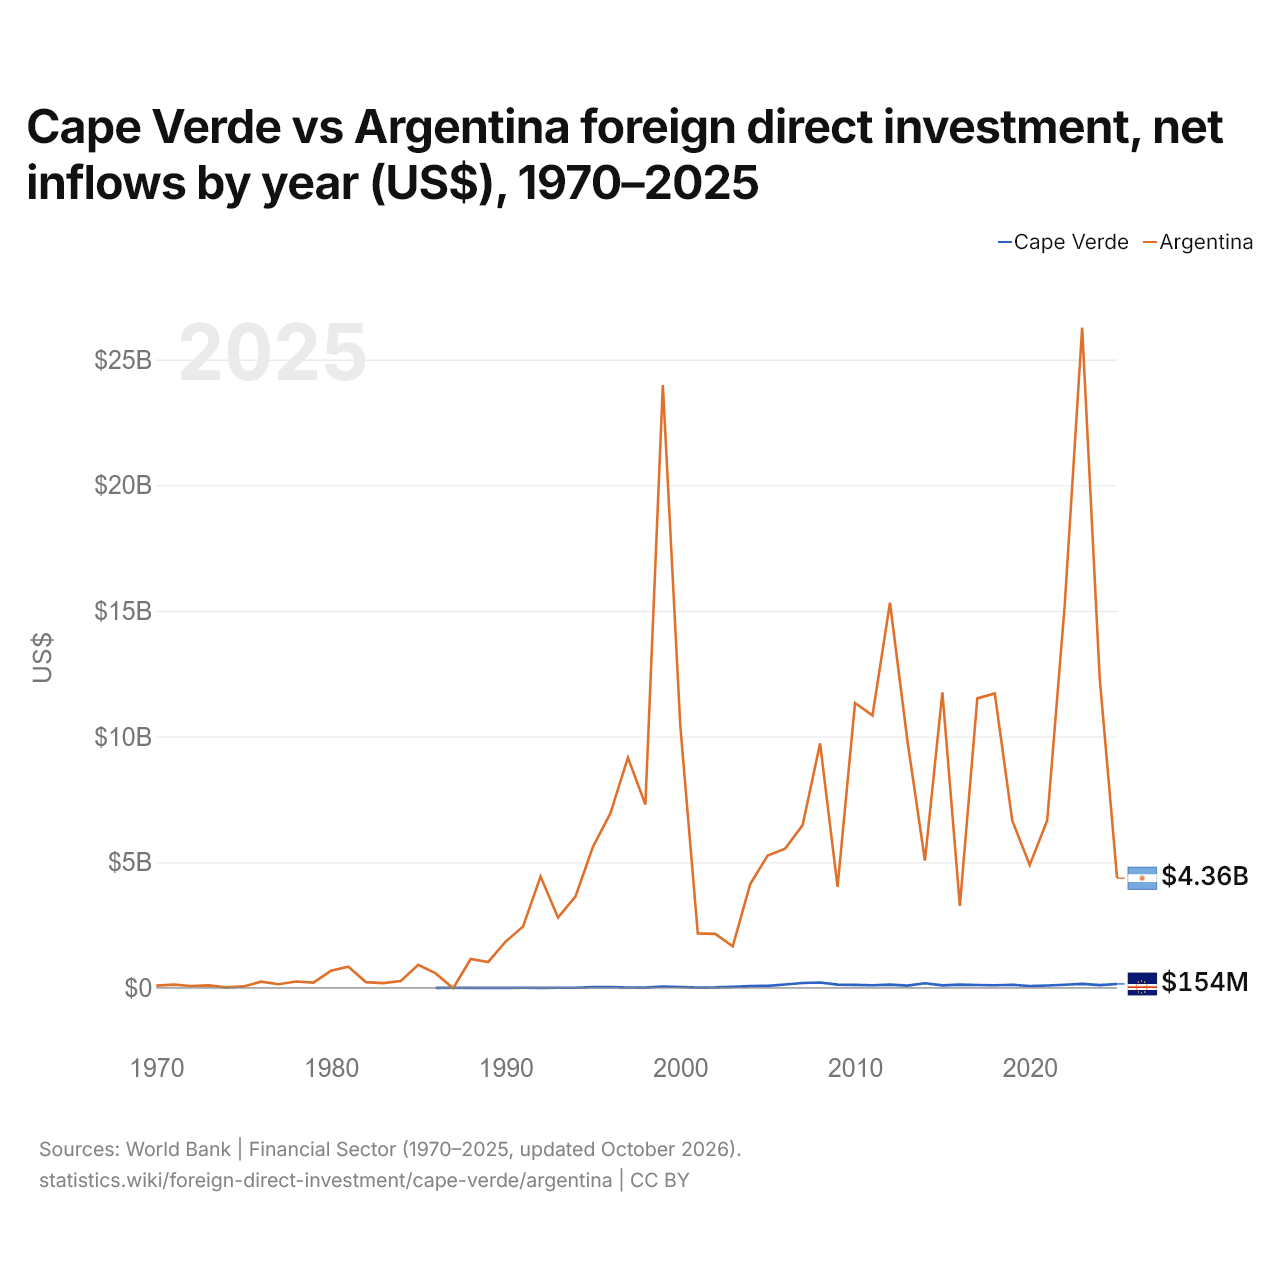
Cap-Vert vs Argentine : investissements directs étrangers, entrées nettes par année ($ US), 1970–2025
| Année | $ US | |
|---|---|---|
 Cap-Vert |
 Argentine |
|
| 2025 | 153 852 100 $ US | 4 361 728 627 $ US |
| 2024 | 109 932 742 $ US | 12 364 505 139 $ US |
| 2023 | 158 735 895 $ US | 26 267 380 170 $ US |
| 2022 | 122 015 529 $ US | 15 206 087 397 $ US |
| 2021 | 91 456 883 $ US | 6 658 049 679 $ US |
| 2020 | 67 619 884 $ US | 4 884 127 676 $ US |
| 2019 | 122 921 295 $ US | 6 649 187 838 $ US |
| 2018 | 103 550 533 $ US | 11 716 769 819 $ US |
| 2017 | 111 711 634 $ US | 11 516 861 462 $ US |
| 2016 | 126 312 006 $ US | 3 260 164 342 $ US |
| 2015 | 96 071 473 $ US | 11 758 994 011 $ US |
| 2014 | 180 589 795 $ US | 5 065 335 542 $ US |
| 2013 | 89 297 444 $ US | 9 821 661 858 $ US |
| 2012 | 128 009 965 $ US | 15 323 933 917 $ US |
| 2011 | 102 246 382 $ US | 10 839 930 945 $ US |
| 2010 | 116 200 564 $ US | 11 332 718 626 $ US |
| 2009 | 126 003 552 $ US | 4 017 158 925 $ US |
| 2008 | 210 903 689 $ US | 9 725 553 130 $ US |
| 2007 | 191 764 359 $ US | 6 473 157 762 $ US |
| 2006 | 131 539 968 $ US | 5 537 347 786 $ US |
| 2005 | 80 513 541 $ US | 5 265 250 000 $ US |
| 2004 | 67 638 274 $ US | 4 124 710 000 $ US |
| 2003 | 39 216 511 $ US | 1 652 010 000 $ US |
| 2002 | 14 759 047 $ US | 2 148 910 000 $ US |
| 2001 | 9 010 186 $ US | 2 166 136 830 $ US |
| 2000 | 34 202 238 $ US | 10 418 314 339 $ US |
| 1999 | 53 935 025 $ US | 23 987 696 390 $ US |
| 1998 | 6 793 745 $ US | 7 290 657 132 $ US |
| 1997 | 11 576 611 $ US | 9 160 272 052 $ US |
| 1996 | 28 528 008 $ US | 6 948 536 687 $ US |
| 1995 | 26 180 647 $ US | 5 609 423 404 $ US |
| 1994 | 2 128 443 $ US | 3 634 931 878 $ US |
| 1993 | 3 644 068 $ US | 2 793 085 410 $ US |
| 1992 | 450 472 $ US | 4 430 977 523 $ US |
| 1991 | 1 744 334 $ US | 2 439 000 000 $ US |
| 1990 | 252 601 $ US | 1 836 000 000 $ US |
| 1989 | 174 023 $ US | 1 028 000 000 $ US |
| 1988 | 597 912 $ US | 1 147 000 000 $ US |
| 1987 | 2 786 141 $ US | −19 000 000 $ US |
| 1986 | −8 734 $ US | 574 000 000 $ US |
| 1985 | - | 919 000 000 $ US |
| 1984 | - | 268 000 000 $ US |
| 1983 | - | 185 000 000 $ US |
| 1982 | - | 227 000 000 $ US |
| 1981 | - | 837 000 000 $ US |
| 1980 | - | 678 000 000 $ US |
| 1979 | - | 206 000 000 $ US |
| 1978 | - | 250 000 000 $ US |
| 1977 | - | 144 000 000 $ US |
| 1976 | - | 244 680 000 $ US |
| 1975 | - | 55 590 000 $ US |
| 1974 | - | 17 920 000 $ US |
| 1973 | - | 100 250 000 $ US |
| 1972 | - | 71 720 000 $ US |
| 1971 | - | 125 670 000 $ US |
| 1970 | - | 89 770 000 $ US |
En 2025, les entrées nettes d'investissements directs étrangers étaient de 154 millions de dollars au Cap-Vert et de 4,36 milliards de dollars en Argentine : 28 fois plus en Argentine. En 1986, elles étaient négatives au Cap-Vert, 8 730 dollars et de 574 millions de dollars en Argentine.
Les entrées nettes d'investissements directs étrangers au Cap-Vert ont été supérieures à celles de l'Argentine pendant une des 40 années de 1986 à 2025, et inférieures pendant 39.
Cap-Vert vs Argentine : dernières entrées et sorties d'investissements étrangers
|
Cap-Vert
|
Argentine
|
|
|---|---|---|
| Entrées nettes | +154 M $US | +4,36 Md $US |
| Entrées nettes, % du PIB | +5,0 % | +0,6 % |
| Sorties nettes | +25,7 M $US | +2,74 Md $US |
| Entrées nettes, total 2016–2025 | +1,17 Md $US | +103 Md $US |
| Rang mondial | 141/192 | 49/192 |
Comparer les investissements directs étrangers de 2 pays au choix
Sources :
- Banque mondiale | Secteur financier (1970–2025, mis à jour en octobre 2026)
Creative Commons Attribution (CC BY) : vous pouvez copier, partager, adapter et réutiliser ce contenu, y compris à des fins commerciales, à condition de citer statistics.wiki et d’indiquer les modifications apportées. Les sources citées ci-dessus peuvent avoir leurs propres conditions de licence.