
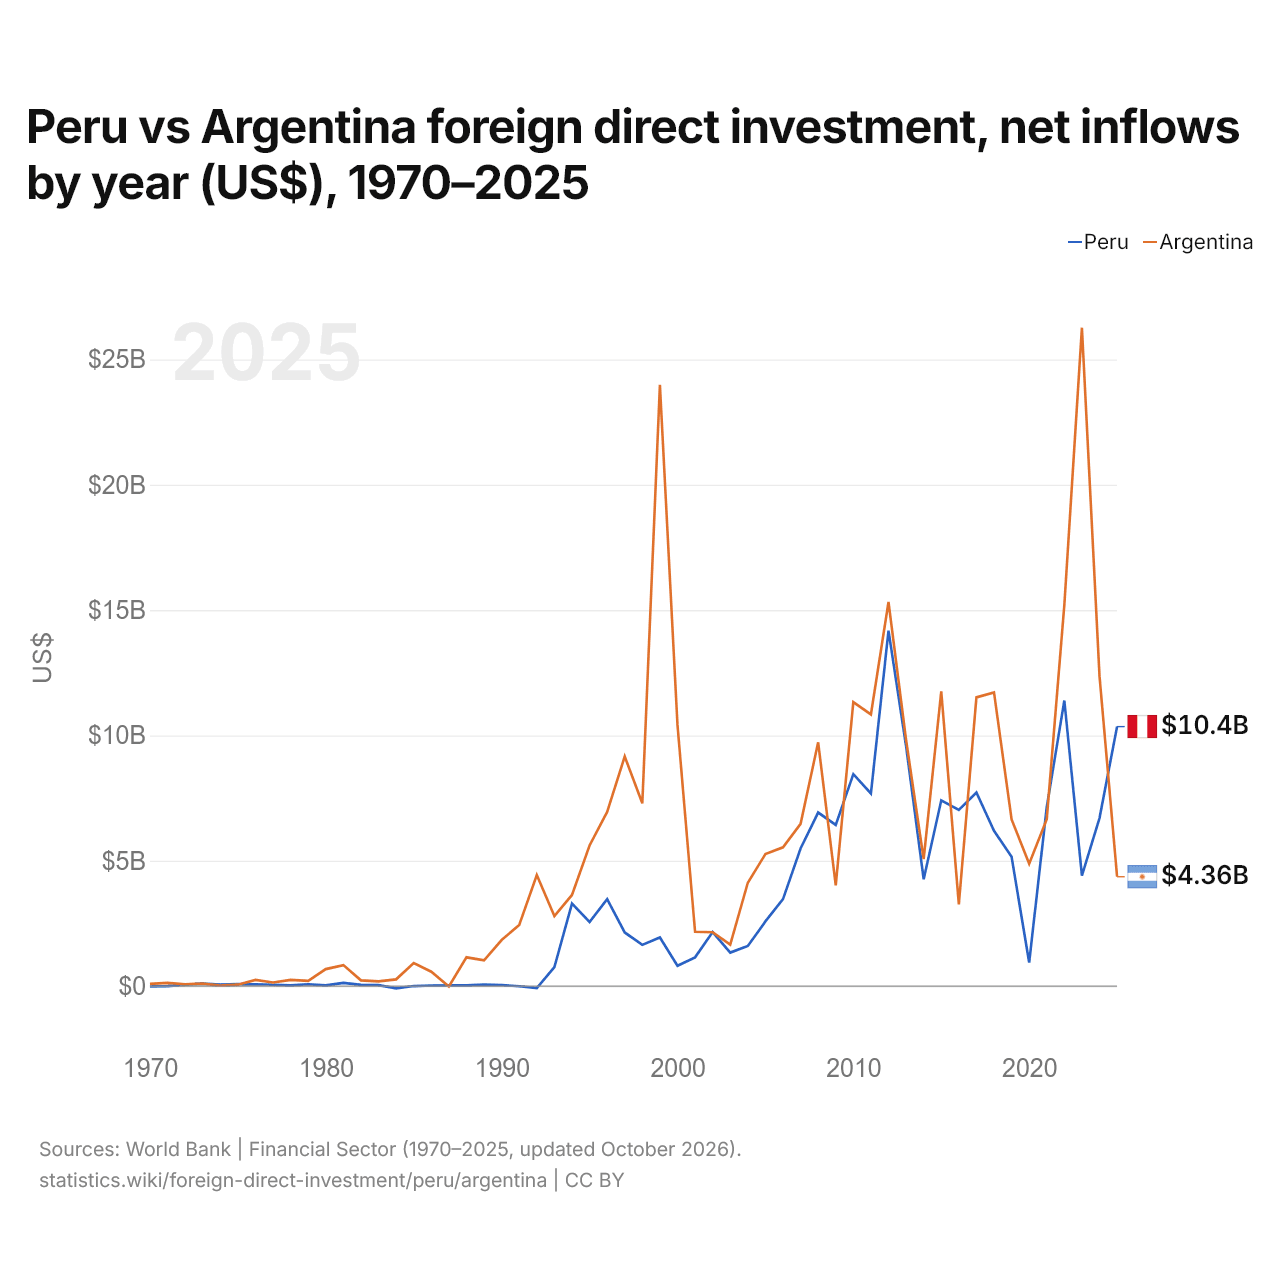
Pérou vs Argentine : investissements directs étrangers, entrées nettes par année ($ US), 1970–2025
| Année | $ US | |
|---|---|---|
 Pérou |
 Argentine |
|
| 2025 | 10 352 930 321 $ US | 4 361 728 627 $ US |
| 2024 | 6 703 887 160 $ US | 12 364 505 139 $ US |
| 2023 | 4 404 587 951 $ US | 26 267 380 170 $ US |
| 2022 | 11 392 825 141 $ US | 15 206 087 397 $ US |
| 2021 | 7 142 277 306 $ US | 6 658 049 679 $ US |
| 2020 | 936 435 194 $ US | 4 884 127 676 $ US |
| 2019 | 5 157 925 040 $ US | 6 649 187 838 $ US |
| 2018 | 6 193 209 997 $ US | 11 716 769 819 $ US |
| 2017 | 7 722 201 474 $ US | 11 516 861 462 $ US |
| 2016 | 7 028 221 062 $ US | 3 260 164 342 $ US |
| 2015 | 7 408 308 299 $ US | 11 758 994 011 $ US |
| 2014 | 4 262 751 634 $ US | 5 065 335 542 $ US |
| 2013 | 9 570 622 714 $ US | 9 821 661 858 $ US |
| 2012 | 14 182 387 604 $ US | 15 323 933 917 $ US |
| 2011 | 7 682 261 109 $ US | 10 839 930 945 $ US |
| 2010 | 8 454 627 588 $ US | 11 332 718 626 $ US |
| 2009 | 6 430 652 961 $ US | 4 017 158 925 $ US |
| 2008 | 6 923 651 285 $ US | 9 725 553 130 $ US |
| 2007 | 5 490 961 307 $ US | 6 473 157 762 $ US |
| 2006 | 3 466 531 061 $ US | 5 537 347 786 $ US |
| 2005 | 2 578 719 365 $ US | 5 265 250 000 $ US |
| 2004 | 1 599 038 389 $ US | 4 124 710 000 $ US |
| 2003 | 1 335 007 073 $ US | 1 652 010 000 $ US |
| 2002 | 2 155 836 815 $ US | 2 148 910 000 $ US |
| 2001 | 1 144 260 000 $ US | 2 166 136 830 $ US |
| 2000 | 809 696 760 $ US | 10 418 314 339 $ US |
| 1999 | 1 940 008 800 $ US | 23 987 696 390 $ US |
| 1998 | 1 643 949 120 $ US | 7 290 657 132 $ US |
| 1997 | 2 139 260 000 $ US | 9 160 272 052 $ US |
| 1996 | 3 471 149 000 $ US | 6 948 536 687 $ US |
| 1995 | 2 556 981 500 $ US | 5 609 423 404 $ US |
| 1994 | 3 289 186 723 $ US | 3 634 931 878 $ US |
| 1993 | 760 588 959 $ US | 2 793 085 410 $ US |
| 1992 | −79 000 000 $ US | 4 430 977 523 $ US |
| 1991 | −7 000 000 $ US | 2 439 000 000 $ US |
| 1990 | 41 000 000 $ US | 1 836 000 000 $ US |
| 1989 | 59 000 000 $ US | 1 028 000 000 $ US |
| 1988 | 26 000 000 $ US | 1 147 000 000 $ US |
| 1987 | 32 000 000 $ US | −19 000 000 $ US |
| 1986 | 22 000 000 $ US | 574 000 000 $ US |
| 1985 | 1 000 000 $ US | 919 000 000 $ US |
| 1984 | −89 000 000 $ US | 268 000 000 $ US |
| 1983 | 38 000 000 $ US | 185 000 000 $ US |
| 1982 | 48 000 000 $ US | 227 000 000 $ US |
| 1981 | 125 000 000 $ US | 837 000 000 $ US |
| 1980 | 26 900 000 $ US | 678 000 000 $ US |
| 1979 | 71 000 000 $ US | 206 000 000 $ US |
| 1978 | 25 000 000 $ US | 250 000 000 $ US |
| 1977 | 54 100 000 $ US | 144 000 000 $ US |
| 1976 | 71 889 000 $ US | 244 680 000 $ US |
| 1975 | 81 105 000 $ US | 55 590 000 $ US |
| 1974 | 62 372 000 $ US | 17 920 000 $ US |
| 1973 | 95 630 000 $ US | 100 250 000 $ US |
| 1972 | 60 313 000 $ US | 71 720 000 $ US |
| 1971 | −3 220 000 $ US | 125 670 000 $ US |
| 1970 | −13 960 000 $ US | 89 770 000 $ US |
En 2025, les entrées nettes d'investissements directs étrangers étaient de 10,4 milliards de dollars au Pérou et de 4,36 milliards de dollars en Argentine : 2,4 fois plus au Pérou. En 1970, elles étaient négatives au Pérou, 14 millions de dollars et de 89,8 millions de dollars en Argentine.
Les entrées nettes d'investissements directs étrangers au Pérou ont été supérieures à celles de l'Argentine pendant 8 des 56 années de 1970 à 2025, et inférieures pendant 48.
Pérou vs Argentine : dernières entrées et sorties d'investissements étrangers
|
Pérou
|
Argentine
|
|
|---|---|---|
| Entrées nettes | +10,4 Md $US | +4,36 Md $US |
| Entrées nettes, % du PIB | +3,1 % | +0,6 % |
| Sorties nettes | +1,42 Md $US | +2,74 Md $US |
| Entrées nettes, total 2016–2025 | +67,0 Md $US | +103 Md $US |
| Rang mondial | 37/192 | 49/192 |
Comparer les investissements directs étrangers de 2 pays au choix
Sources :
- Banque mondiale | Secteur financier (1970–2025, mis à jour en octobre 2026)
Creative Commons Attribution (CC BY) : vous pouvez copier, partager, adapter et réutiliser ce contenu, y compris à des fins commerciales, à condition de citer statistics.wiki et d’indiquer les modifications apportées. Les sources citées ci-dessus peuvent avoir leurs propres conditions de licence.