
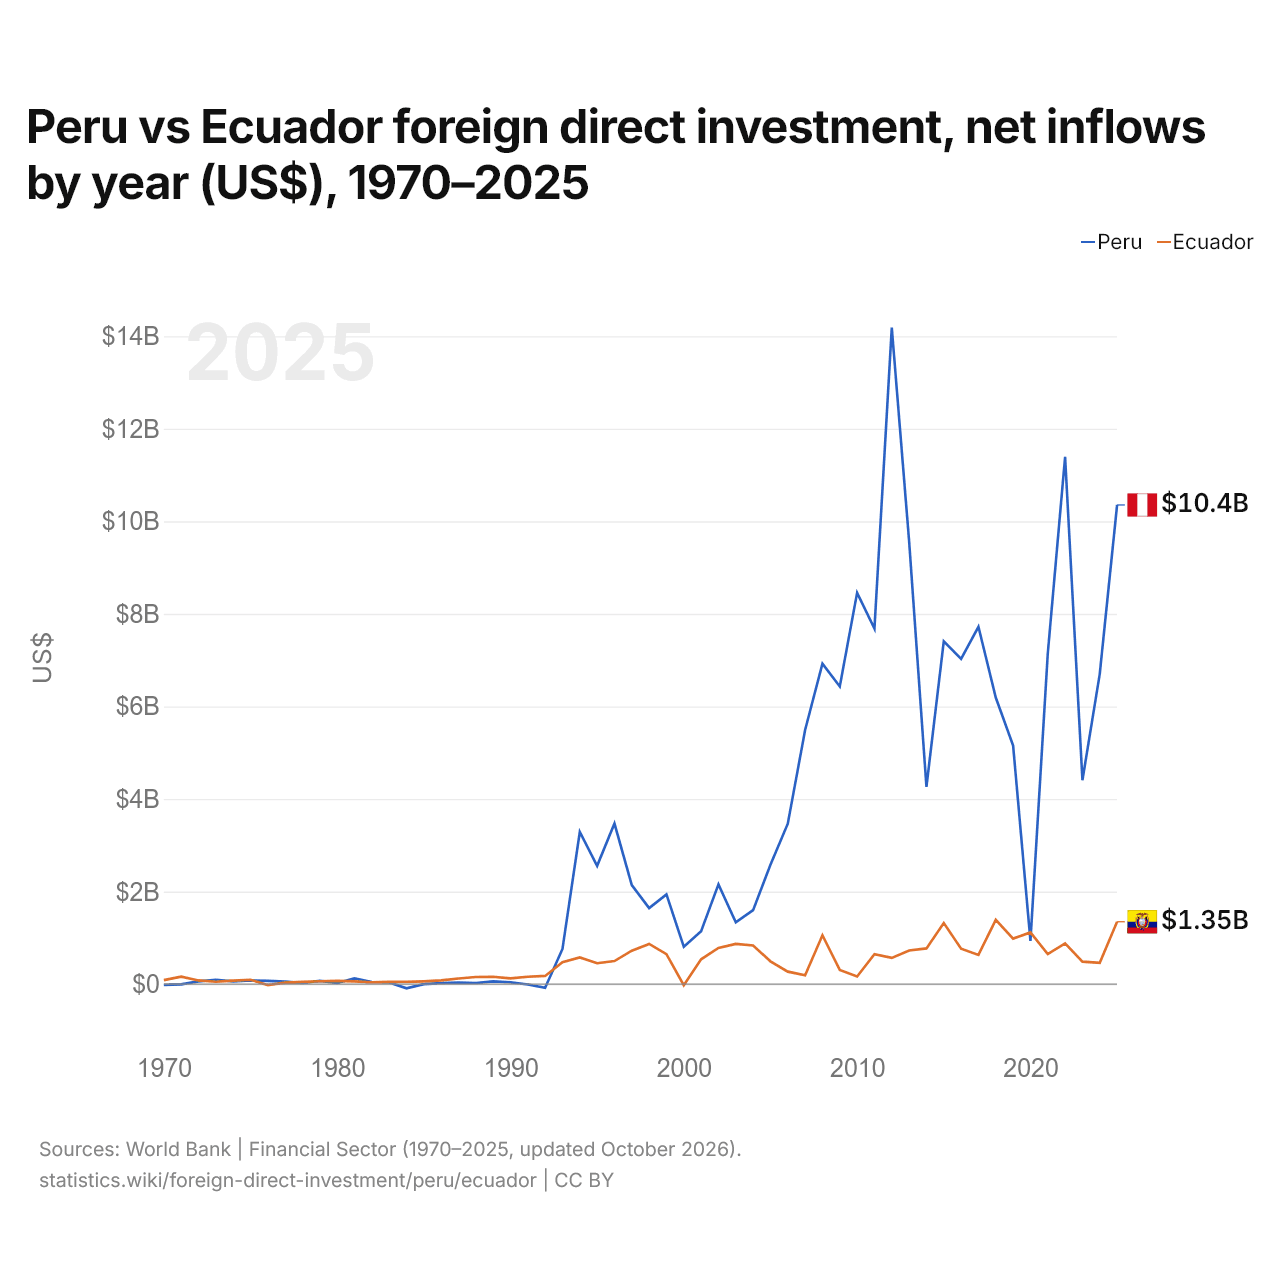
Pérou vs Équateur : investissements directs étrangers, entrées nettes par année ($ US), 1970–2025
| Année | $ US | |
|---|---|---|
 Pérou |
 Équateur |
|
| 2025 | 10 352 930 321 $ US | 1 348 939 390 $ US |
| 2024 | 6 703 887 160 $ US | 461 697 172 $ US |
| 2023 | 4 404 587 951 $ US | 487 316 931 $ US |
| 2022 | 11 392 825 141 $ US | 881 729 804 $ US |
| 2021 | 7 142 277 306 $ US | 651 118 151 $ US |
| 2020 | 936 435 194 $ US | 1 119 274 901 $ US |
| 2019 | 5 157 925 040 $ US | 984 564 496 $ US |
| 2018 | 6 193 209 997 $ US | 1 390 293 763 $ US |
| 2017 | 7 722 201 474 $ US | 632 320 412 $ US |
| 2016 | 7 028 221 062 $ US | 766 424 868 $ US |
| 2015 | 7 408 308 299 $ US | 1 322 701 337 $ US |
| 2014 | 4 262 751 634 $ US | 772 389 946 $ US |
| 2013 | 9 570 622 714 $ US | 727 081 206 $ US |
| 2012 | 14 182 387 604 $ US | 567 417 301 $ US |
| 2011 | 7 682 261 109 $ US | 646 084 359 $ US |
| 2010 | 8 454 627 588 $ US | 165 893 320 $ US |
| 2009 | 6 430 652 961 $ US | 308 629 890 $ US |
| 2008 | 6 923 651 285 $ US | 1 057 404 020 $ US |
| 2007 | 5 490 961 307 $ US | 193 872 527 $ US |
| 2006 | 3 466 531 061 $ US | 271 428 853 $ US |
| 2005 | 2 578 719 365 $ US | 493 413 836 $ US |
| 2004 | 1 599 038 389 $ US | 836 939 594 $ US |
| 2003 | 1 335 007 073 $ US | 871 513 414 $ US |
| 2002 | 2 155 836 815 $ US | 783 261 010 $ US |
| 2001 | 1 144 260 000 $ US | 538 568 575 $ US |
| 2000 | 809 696 760 $ US | −23 439 368 $ US |
| 1999 | 1 940 008 800 $ US | 648 410 000 $ US |
| 1998 | 1 643 949 120 $ US | 869 980 000 $ US |
| 1997 | 2 139 260 000 $ US | 723 950 000 $ US |
| 1996 | 3 471 149 000 $ US | 499 680 000 $ US |
| 1995 | 2 556 981 500 $ US | 452 480 000 $ US |
| 1994 | 3 289 186 723 $ US | 576 330 000 $ US |
| 1993 | 760 588 959 $ US | 473 720 000 $ US |
| 1992 | −79 000 000 $ US | 178 000 000 $ US |
| 1991 | −7 000 000 $ US | 160 000 000 $ US |
| 1990 | 41 000 000 $ US | 126 000 000 $ US |
| 1989 | 59 000 000 $ US | 160 000 000 $ US |
| 1988 | 26 000 000 $ US | 155 000 000 $ US |
| 1987 | 32 000 000 $ US | 123 000 000 $ US |
| 1986 | 22 000 000 $ US | 81 000 000 $ US |
| 1985 | 1 000 000 $ US | 62 000 000 $ US |
| 1984 | −89 000 000 $ US | 50 000 000 $ US |
| 1983 | 38 000 000 $ US | 50 000 000 $ US |
| 1982 | 48 000 000 $ US | 40 000 000 $ US |
| 1981 | 125 000 000 $ US | 60 000 000 $ US |
| 1980 | 26 900 000 $ US | 70 000 000 $ US |
| 1979 | 71 000 000 $ US | 63 400 000 $ US |
| 1978 | 25 000 000 $ US | 48 600 000 $ US |
| 1977 | 54 100 000 $ US | 34 500 000 $ US |
| 1976 | 71 889 000 $ US | −19 900 000 $ US |
| 1975 | 81 105 000 $ US | 95 300 000 $ US |
| 1974 | 62 372 000 $ US | 76 800 000 $ US |
| 1973 | 95 630 000 $ US | 52 300 000 $ US |
| 1972 | 60 313 000 $ US | 80 800 000 $ US |
| 1971 | −3 220 000 $ US | 162 100 000 $ US |
| 1970 | −13 960 000 $ US | 88 600 000 $ US |
En 2025, les entrées nettes d'investissements directs étrangers étaient de 10,4 milliards de dollars au Pérou et de 1,35 milliard de dollars en Équateur : 7,7 fois plus au Pérou. En 1970, elles étaient négatives au Pérou, 14 millions de dollars et de 88,6 millions de dollars en Équateur.
Les entrées nettes d'investissements directs étrangers au Pérou ont été supérieures à celles de l'Équateur pendant 38 des 56 années de 1970 à 2025, et inférieures pendant 18.
Pérou vs Équateur : dernières entrées et sorties d'investissements étrangers
|
Pérou
|
Équateur
|
|
|---|---|---|
| Entrées nettes | +10,4 Md $US | +1,35 Md $US |
| Entrées nettes, % du PIB | +3,1 % | +1,0 % |
| Sorties nettes | +1,42 Md $US (2025) | n.d. |
| Entrées nettes, total 2016–2025 | +67,0 Md $US | +8,72 Md $US |
| Rang mondial | 37/192 | 85/192 |
Comparer les investissements directs étrangers de 2 pays au choix
Sources :
- Banque mondiale | Secteur financier (1970–2025, mis à jour en octobre 2026)
Creative Commons Attribution (CC BY) : vous pouvez copier, partager, adapter et réutiliser ce contenu, y compris à des fins commerciales, à condition de citer statistics.wiki et d’indiquer les modifications apportées. Les sources citées ci-dessus peuvent avoir leurs propres conditions de licence.