
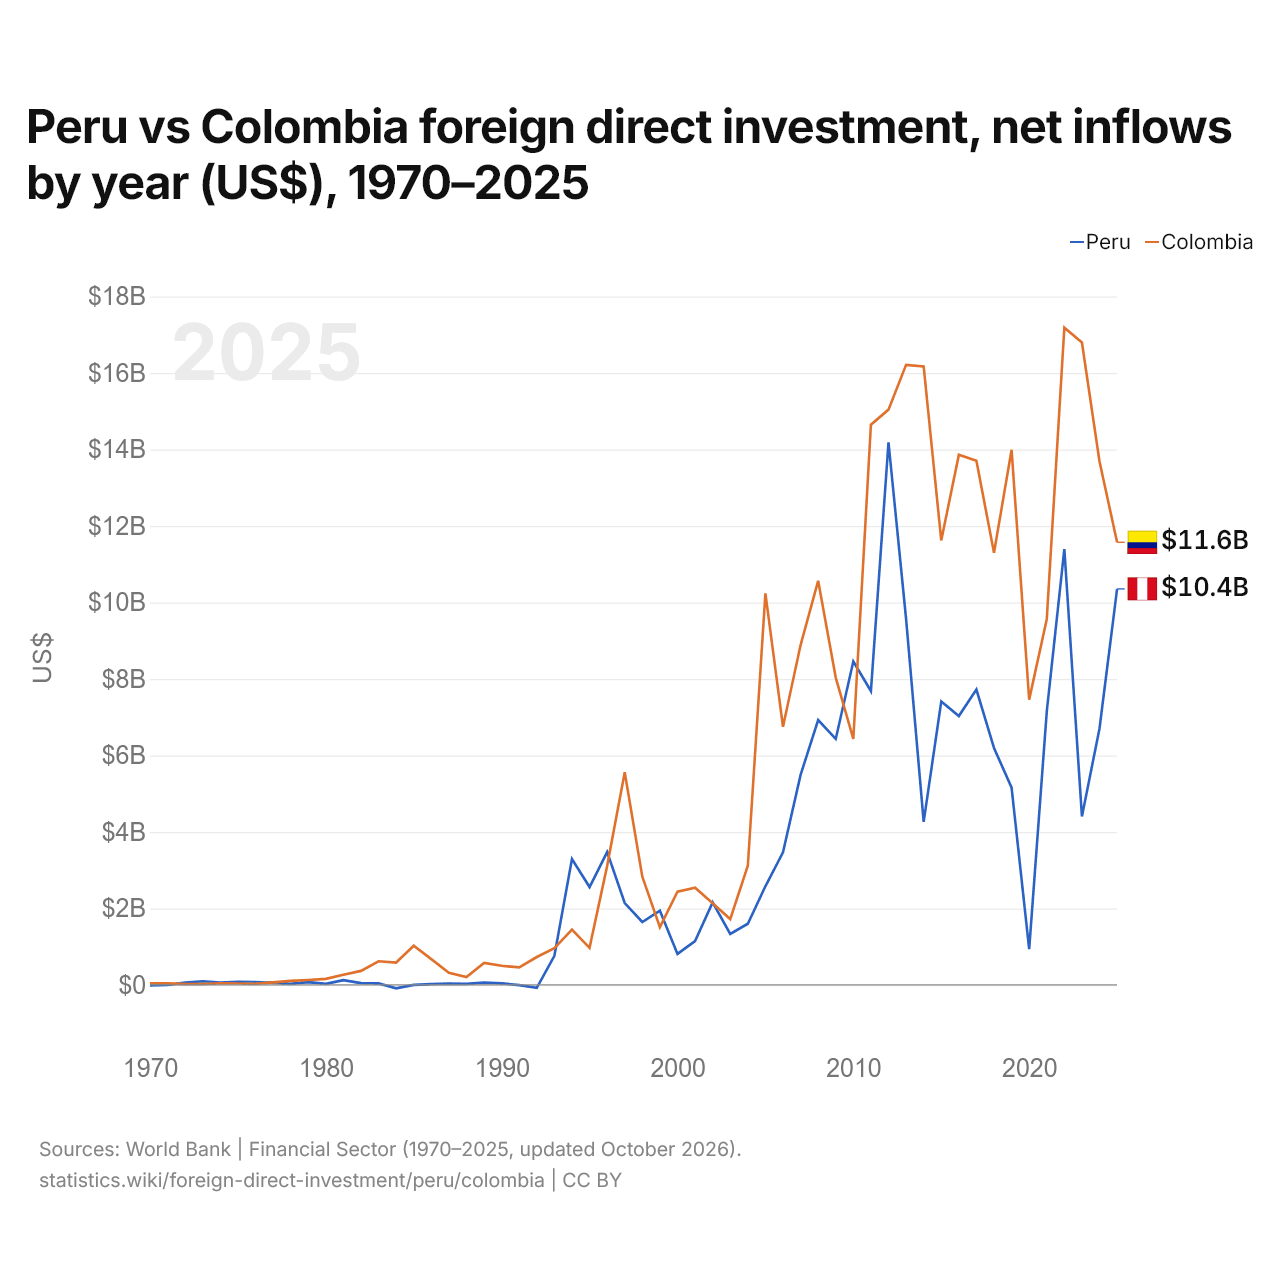
Pérou vs Colombie : investissements directs étrangers, entrées nettes par année ($ US), 1970–2025
| Année | $ US | |
|---|---|---|
 Pérou |
 Colombie |
|
| 2025 | 10 352 930 321 $ US | 11 571 143 771 $ US |
| 2024 | 6 703 887 160 $ US | 13 683 876 155 $ US |
| 2023 | 4 404 587 951 $ US | 16 793 702 729 $ US |
| 2022 | 11 392 825 141 $ US | 17 182 225 498 $ US |
| 2021 | 7 142 277 306 $ US | 9 561 335 277 $ US |
| 2020 | 936 435 194 $ US | 7 458 624 984 $ US |
| 2019 | 5 157 925 040 $ US | 13 989 154 028 $ US |
| 2018 | 6 193 209 997 $ US | 11 298 692 774 $ US |
| 2017 | 7 722 201 474 $ US | 13 700 880 445 $ US |
| 2016 | 7 028 221 062 $ US | 13 857 937 721 $ US |
| 2015 | 7 408 308 299 $ US | 11 620 532 646 $ US |
| 2014 | 4 262 751 634 $ US | 16 168 701 715 $ US |
| 2013 | 9 570 622 714 $ US | 16 210 419 016 $ US |
| 2012 | 14 182 387 604 $ US | 15 039 979 139 $ US |
| 2011 | 7 682 261 109 $ US | 14 647 048 638 $ US |
| 2010 | 8 454 627 588 $ US | 6 429 989 613 $ US |
| 2009 | 6 430 652 961 $ US | 8 034 746 177 $ US |
| 2008 | 6 923 651 285 $ US | 10 564 155 796 $ US |
| 2007 | 5 490 961 307 $ US | 8 885 764 398 $ US |
| 2006 | 3 466 531 061 $ US | 6 750 625 311 $ US |
| 2005 | 2 578 719 365 $ US | 10 235 417 315 $ US |
| 2004 | 1 599 038 389 $ US | 3 115 635 874 $ US |
| 2003 | 1 335 007 073 $ US | 1 720 493 455 $ US |
| 2002 | 2 155 836 815 $ US | 2 133 698 124 $ US |
| 2001 | 1 144 260 000 $ US | 2 541 942 612 $ US |
| 2000 | 809 696 760 $ US | 2 436 459 923 $ US |
| 1999 | 1 940 008 800 $ US | 1 507 907 130 $ US |
| 1998 | 1 643 949 120 $ US | 2 828 826 262 $ US |
| 1997 | 2 139 260 000 $ US | 5 562 216 362 $ US |
| 1996 | 3 471 149 000 $ US | 3 111 676 590 $ US |
| 1995 | 2 556 981 500 $ US | 968 368 274 $ US |
| 1994 | 3 289 186 723 $ US | 1 446 497 261 $ US |
| 1993 | 760 588 959 $ US | 959 100 000 $ US |
| 1992 | −79 000 000 $ US | 728 700 000 $ US |
| 1991 | −7 000 000 $ US | 456 900 000 $ US |
| 1990 | 41 000 000 $ US | 500 000 000 $ US |
| 1989 | 59 000 000 $ US | 576 000 000 $ US |
| 1988 | 26 000 000 $ US | 203 000 000 $ US |
| 1987 | 32 000 000 $ US | 319 000 000 $ US |
| 1986 | 22 000 000 $ US | 674 000 000 $ US |
| 1985 | 1 000 000 $ US | 1 023 000 000 $ US |
| 1984 | −89 000 000 $ US | 584 000 000 $ US |
| 1983 | 38 000 000 $ US | 618 000 000 $ US |
| 1982 | 48 000 000 $ US | 366 000 000 $ US |
| 1981 | 125 000 000 $ US | 265 000 000 $ US |
| 1980 | 26 900 000 $ US | 157 137 700 $ US |
| 1979 | 71 000 000 $ US | 127 000 000 $ US |
| 1978 | 25 000 000 $ US | 107 000 000 $ US |
| 1977 | 54 100 000 $ US | 65 000 000 $ US |
| 1976 | 71 889 000 $ US | 25 000 000 $ US |
| 1975 | 81 105 000 $ US | 37 068 850 $ US |
| 1974 | 62 372 000 $ US | 40 889 760 $ US |
| 1973 | 95 630 000 $ US | 23 842 600 $ US |
| 1972 | 60 313 000 $ US | 18 457 070 $ US |
| 1971 | −3 220 000 $ US | 43 128 140 $ US |
| 1970 | −13 960 000 $ US | 43 000 000 $ US |
En 2025, les entrées nettes d'investissements directs étrangers étaient de 10,4 milliards de dollars au Pérou et de 11,6 milliards de dollars en Colombie : 12 % de plus en Colombie. En 1970, elles étaient négatives au Pérou, 14 millions de dollars et de 43 millions de dollars en Colombie.
Les entrées nettes d'investissements directs étrangers au Pérou ont été supérieures à celles de la Colombie pendant 11 des 56 années de 1970 à 2025, et inférieures pendant 45.
Pérou vs Colombie : dernières entrées et sorties d'investissements étrangers
|
Pérou
|
Colombie
|
|
|---|---|---|
| Entrées nettes | +10,4 Md $US | +11,6 Md $US |
| Entrées nettes, % du PIB | +3,1 % | +2,5 % |
| Sorties nettes | +1,42 Md $US | +4,82 Md $US |
| Entrées nettes, total 2016–2025 | +67,0 Md $US | +129 Md $US |
| Rang mondial | 37/192 | 33/192 |
Comparer les investissements directs étrangers de 2 pays au choix
Sources :
- Banque mondiale | Secteur financier (1970–2025, mis à jour en octobre 2026)
Creative Commons Attribution (CC BY) : vous pouvez copier, partager, adapter et réutiliser ce contenu, y compris à des fins commerciales, à condition de citer statistics.wiki et d’indiquer les modifications apportées. Les sources citées ci-dessus peuvent avoir leurs propres conditions de licence.