
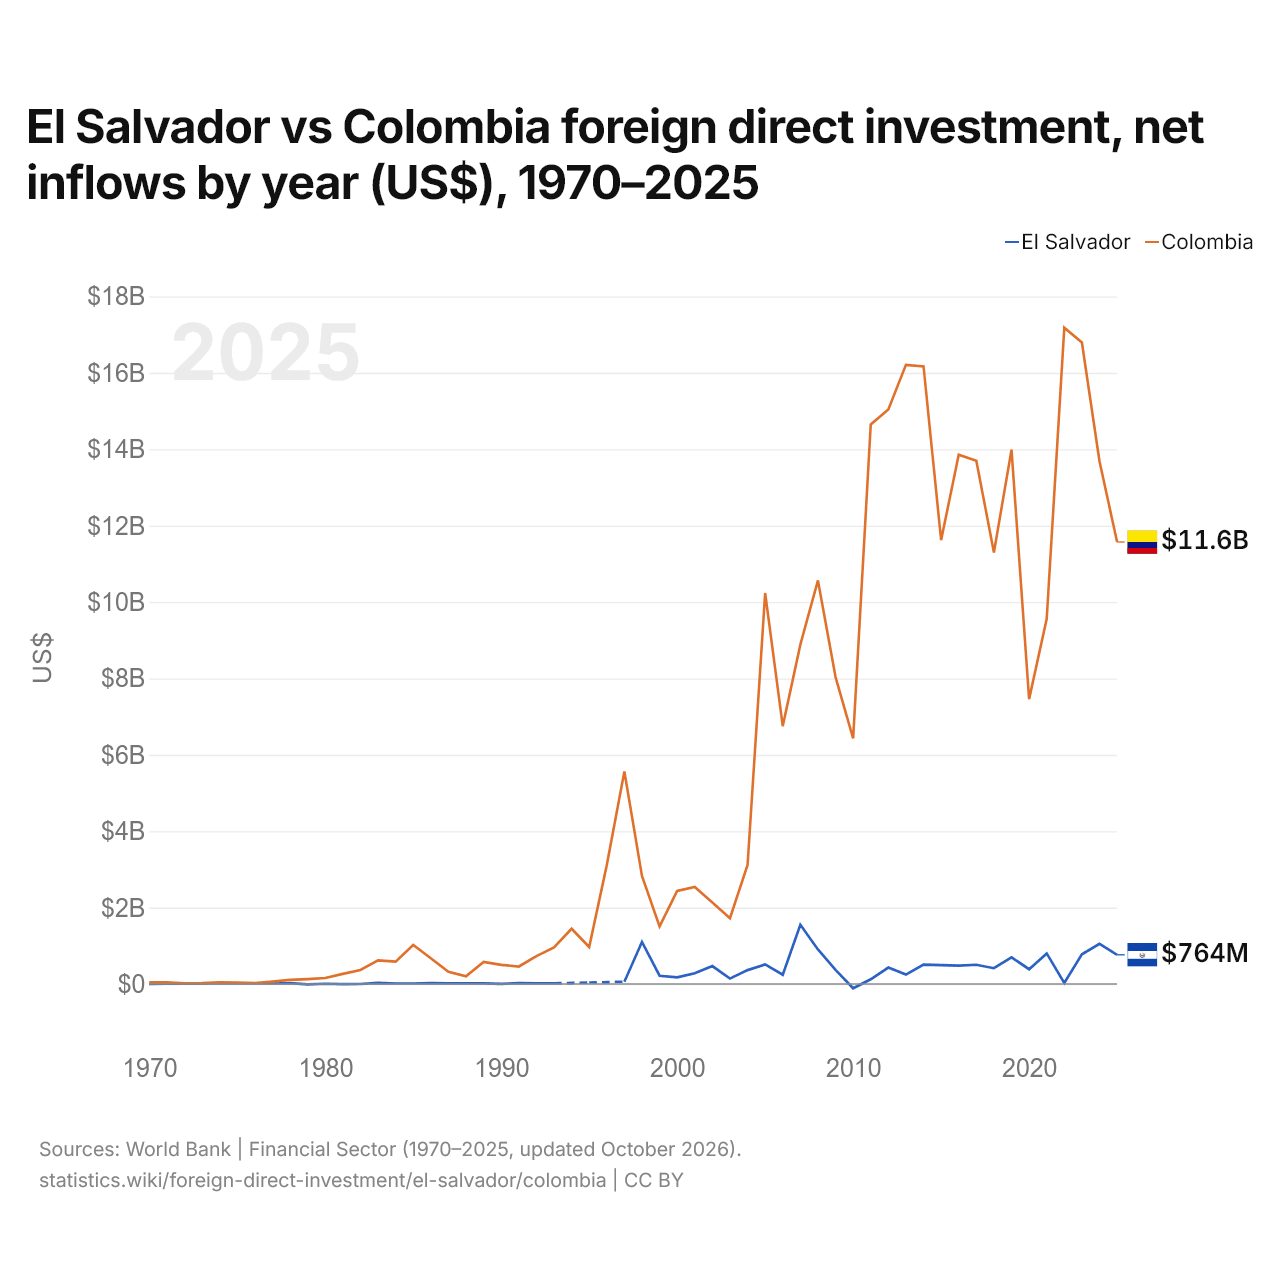
Salvador vs Colombie : investissements directs étrangers, entrées nettes par année ($ US), 1970–2025
| Année | $ US | |
|---|---|---|
 Salvador |
 Colombie |
|
| 2025 | 763 722 779 $ US | 11 571 143 771 $ US |
| 2024 | 1 050 986 142 $ US | 13 683 876 155 $ US |
| 2023 | 778 284 501 $ US | 16 793 702 729 $ US |
| 2022 | 26 235 087 $ US | 17 182 225 498 $ US |
| 2021 | 800 443 455 $ US | 9 561 335 277 $ US |
| 2020 | 386 532 638 $ US | 7 458 624 984 $ US |
| 2019 | 696 287 033 $ US | 13 989 154 028 $ US |
| 2018 | 412 743 968 $ US | 11 298 692 774 $ US |
| 2017 | 503 801 415 $ US | 13 700 880 445 $ US |
| 2016 | 479 469 381 $ US | 13 857 937 721 $ US |
| 2015 | 494 541 718 $ US | 11 620 532 646 $ US |
| 2014 | 506 295 970 $ US | 16 168 701 715 $ US |
| 2013 | 245 179 098 $ US | 16 210 419 016 $ US |
| 2012 | 430 126 688 $ US | 15 039 979 139 $ US |
| 2011 | 122 500 004 $ US | 14 647 048 638 $ US |
| 2010 | −113 160 684 $ US | 6 429 989 613 $ US |
| 2009 | 368 730 000 $ US | 8 034 746 177 $ US |
| 2008 | 903 050 000 $ US | 10 564 155 796 $ US |
| 2007 | 1 550 510 000 $ US | 8 885 764 398 $ US |
| 2006 | 241 130 000 $ US | 6 750 625 311 $ US |
| 2005 | 511 140 000 $ US | 10 235 417 315 $ US |
| 2004 | 363 270 000 $ US | 3 115 635 874 $ US |
| 2003 | 141 200 000 $ US | 1 720 493 455 $ US |
| 2002 | 470 000 000 $ US | 2 133 698 124 $ US |
| 2001 | 278 900 000 $ US | 2 541 942 612 $ US |
| 2000 | 173 400 000 $ US | 2 436 459 923 $ US |
| 1999 | 215 800 000 $ US | 1 507 907 130 $ US |
| 1998 | 1 102 684 180 $ US | 2 828 826 262 $ US |
| 1997 | 59 043 540 $ US | 5 562 216 362 $ US |
| 1996 | - | 3 111 676 590 $ US |
| 1995 | 38 037 219 $ US | 968 368 274 $ US |
| 1994 | - | 1 446 497 261 $ US |
| 1993 | 16 432 044 $ US | 959 100 000 $ US |
| 1992 | 15 309 479 $ US | 728 700 000 $ US |
| 1991 | 25 180 499 $ US | 456 900 000 $ US |
| 1990 | 1 898 272 $ US | 500 000 000 $ US |
| 1989 | 14 360 000 $ US | 576 000 000 $ US |
| 1988 | 16 960 000 $ US | 203 000 000 $ US |
| 1987 | 18 320 000 $ US | 319 000 000 $ US |
| 1986 | 24 133 631 $ US | 674 000 000 $ US |
| 1985 | 12 400 000 $ US | 1 023 000 000 $ US |
| 1984 | 12 360 000 $ US | 584 000 000 $ US |
| 1983 | 28 080 000 $ US | 618 000 000 $ US |
| 1982 | −1 000 000 $ US | 366 000 000 $ US |
| 1981 | −5 720 000 $ US | 265 000 000 $ US |
| 1980 | 5 880 000 $ US | 157 137 700 $ US |
| 1979 | −9 960 000 $ US | 127 000 000 $ US |
| 1978 | 23 360 000 $ US | 107 000 000 $ US |
| 1977 | 18 640 000 $ US | 65 000 000 $ US |
| 1976 | 12 960 000 $ US | 25 000 000 $ US |
| 1975 | 13 100 000 $ US | 37 068 850 $ US |
| 1974 | 20 100 000 $ US | 40 889 760 $ US |
| 1973 | 6 000 000 $ US | 23 842 600 $ US |
| 1972 | 6 600 000 $ US | 18 457 070 $ US |
| 1971 | 7 000 000 $ US | 43 128 140 $ US |
| 1970 | 3 700 000 $ US | 43 000 000 $ US |
En 2025, les entrées nettes d'investissements directs étrangers étaient de 764 millions de dollars au Salvador et de 11,6 milliards de dollars en Colombie : 15 fois plus en Colombie. En 1970, elles étaient de 3,7 millions de dollars au Salvador et de 43 millions de dollars en Colombie.
Les entrées nettes d'investissements directs étrangers au Salvador ont été inférieures à celles de la Colombie chacune des 54 années de 1970 à 2025 que les deux pays ont communiquées.
Salvador vs Colombie : dernières entrées et sorties d'investissements étrangers
|
Salvador
|
Colombie
|
|
|---|---|---|
| Entrées nettes | +764 M $US | +11,6 Md $US |
| Entrées nettes, % du PIB | +2,1 % | +2,5 % |
| Sorties nettes | +318 M $US | +4,82 Md $US |
| Entrées nettes, total 2016–2025 | +5,90 Md $US | +129 Md $US |
| Rang mondial | 105/192 | 33/192 |
Comparer les investissements directs étrangers de 2 pays au choix
Sources :
- Banque mondiale | Secteur financier (1970–2025, mis à jour en octobre 2026)
Creative Commons Attribution (CC BY) : vous pouvez copier, partager, adapter et réutiliser ce contenu, y compris à des fins commerciales, à condition de citer statistics.wiki et d’indiquer les modifications apportées. Les sources citées ci-dessus peuvent avoir leurs propres conditions de licence.