
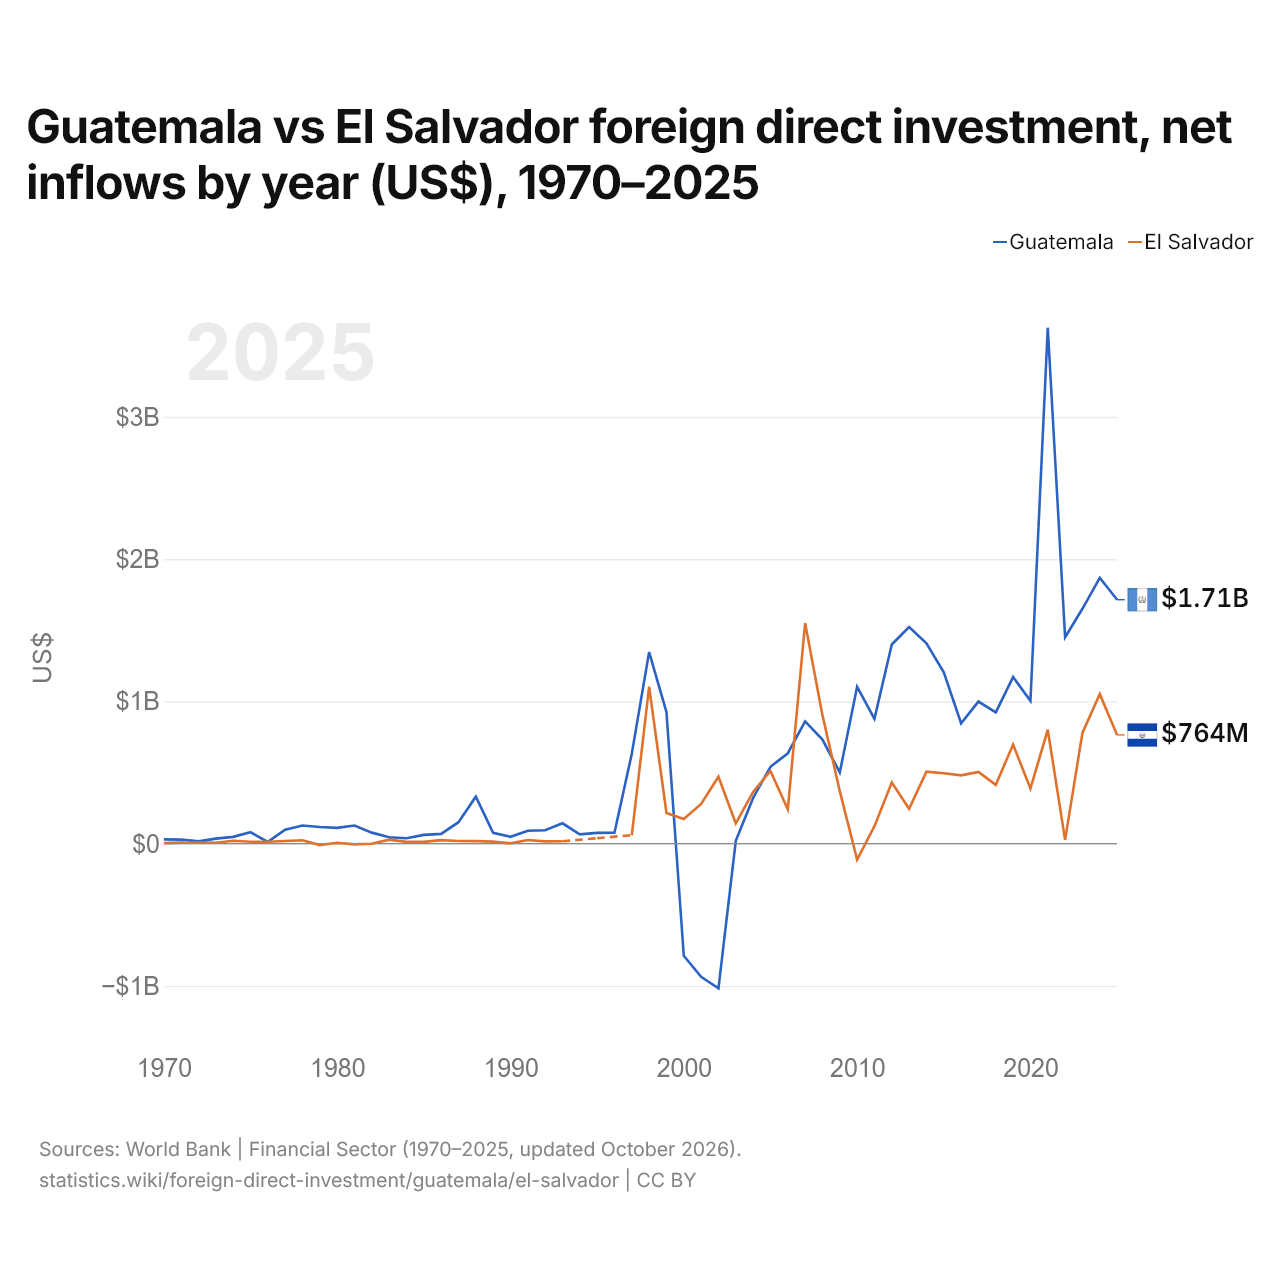
Guatemala vs Salvador : investissements directs étrangers, entrées nettes par année ($ US), 1970–2025
| Année | $ US | |
|---|---|---|
 Guatemala |
 Salvador |
|
| 2025 | 1 714 293 720 $ US | 763 722 779 $ US |
| 2024 | 1 868 650 070 $ US | 1 050 986 142 $ US |
| 2023 | 1 650 310 370 $ US | 778 284 501 $ US |
| 2022 | 1 450 072 830 $ US | 26 235 087 $ US |
| 2021 | 3 626 364 530 $ US | 800 443 455 $ US |
| 2020 | 1 004 371 660 $ US | 386 532 638 $ US |
| 2019 | 1 170 758 860 $ US | 696 287 033 $ US |
| 2018 | 922 397 870 $ US | 412 743 968 $ US |
| 2017 | 998 344 470 $ US | 503 801 415 $ US |
| 2016 | 845 786 560 $ US | 479 469 381 $ US |
| 2015 | 1 203 355 080 $ US | 494 541 718 $ US |
| 2014 | 1 407 555 280 $ US | 506 295 970 $ US |
| 2013 | 1 522 143 500 $ US | 245 179 098 $ US |
| 2012 | 1 399 819 890 $ US | 430 126 688 $ US |
| 2011 | 876 760 590 $ US | 122 500 004 $ US |
| 2010 | 1 102 460 180 $ US | −113 160 684 $ US |
| 2009 | 499 821 250 $ US | 368 730 000 $ US |
| 2008 | 731 386 670 $ US | 903 050 000 $ US |
| 2007 | 859 200 000 $ US | 1 550 510 000 $ US |
| 2006 | 635 300 000 $ US | 241 130 000 $ US |
| 2005 | 540 000 000 $ US | 511 140 000 $ US |
| 2004 | 321 400 000 $ US | 363 270 000 $ US |
| 2003 | 19 488 618 $ US | 141 200 000 $ US |
| 2002 | −1 016 996 774 $ US | 470 000 000 $ US |
| 2001 | −936 494 410 $ US | 278 900 000 $ US |
| 2000 | −788 600 000 $ US | 173 400 000 $ US |
| 1999 | 924 600 000 $ US | 215 800 000 $ US |
| 1998 | 1 346 300 000 $ US | 1 102 684 180 $ US |
| 1997 | 631 400 000 $ US | 59 043 540 $ US |
| 1996 | 76 900 000 $ US | - |
| 1995 | 75 200 000 $ US | 38 037 219 $ US |
| 1994 | 65 200 000 $ US | - |
| 1993 | 142 500 000 $ US | 16 432 044 $ US |
| 1992 | 94 100 000 $ US | 15 309 479 $ US |
| 1991 | 90 700 000 $ US | 25 180 499 $ US |
| 1990 | 47 700 000 $ US | 1 898 272 $ US |
| 1989 | 76 200 000 $ US | 14 360 000 $ US |
| 1988 | 329 900 000 $ US | 16 960 000 $ US |
| 1987 | 150 200 000 $ US | 18 320 000 $ US |
| 1986 | 68 800 000 $ US | 24 133 631 $ US |
| 1985 | 61 800 000 $ US | 12 400 000 $ US |
| 1984 | 38 000 000 $ US | 12 360 000 $ US |
| 1983 | 45 000 000 $ US | 28 080 000 $ US |
| 1982 | 77 100 000 $ US | −1 000 000 $ US |
| 1981 | 127 100 000 $ US | −5 720 000 $ US |
| 1980 | 110 700 000 $ US | 5 880 000 $ US |
| 1979 | 117 000 000 $ US | −9 960 000 $ US |
| 1978 | 127 200 000 $ US | 23 360 000 $ US |
| 1977 | 97 500 000 $ US | 18 640 000 $ US |
| 1976 | 12 500 000 $ US | 12 960 000 $ US |
| 1975 | 80 000 000 $ US | 13 100 000 $ US |
| 1974 | 47 400 000 $ US | 20 100 000 $ US |
| 1973 | 34 800 000 $ US | 6 000 000 $ US |
| 1972 | 15 900 000 $ US | 6 600 000 $ US |
| 1971 | 28 600 000 $ US | 7 000 000 $ US |
| 1970 | 29 400 000 $ US | 3 700 000 $ US |
En 2025, les entrées nettes d'investissements directs étrangers étaient de 1,71 milliard de dollars au Guatemala et de 764 millions de dollars au Salvador : 2,2 fois plus au Guatemala. En 1970, elles étaient de 29,4 millions de dollars au Guatemala et de 3,7 millions de dollars au Salvador.
Les entrées nettes d'investissements directs étrangers au Guatemala ont été supérieures à celles du Salvador pendant 46 des 54 années de 1970 à 2025 que les deux pays ont communiquées, et inférieures pendant 8.
Guatemala vs Salvador : dernières entrées et sorties d'investissements étrangers
|
Guatemala
|
Salvador
|
|
|---|---|---|
| Entrées nettes | +1,71 Md $US | +764 M $US |
| Entrées nettes, % du PIB | +1,4 % | +2,1 % |
| Sorties nettes | +2,34 Md $US | +318 M $US |
| Entrées nettes, total 2016–2025 | +15,3 Md $US | +5,90 Md $US |
| Rang mondial | 75/192 | 105/192 |
Comparer les investissements directs étrangers de 2 pays au choix
Sources :
- Banque mondiale | Secteur financier (1970–2025, mis à jour en octobre 2026)
Creative Commons Attribution (CC BY) : vous pouvez copier, partager, adapter et réutiliser ce contenu, y compris à des fins commerciales, à condition de citer statistics.wiki et d’indiquer les modifications apportées. Les sources citées ci-dessus peuvent avoir leurs propres conditions de licence.