
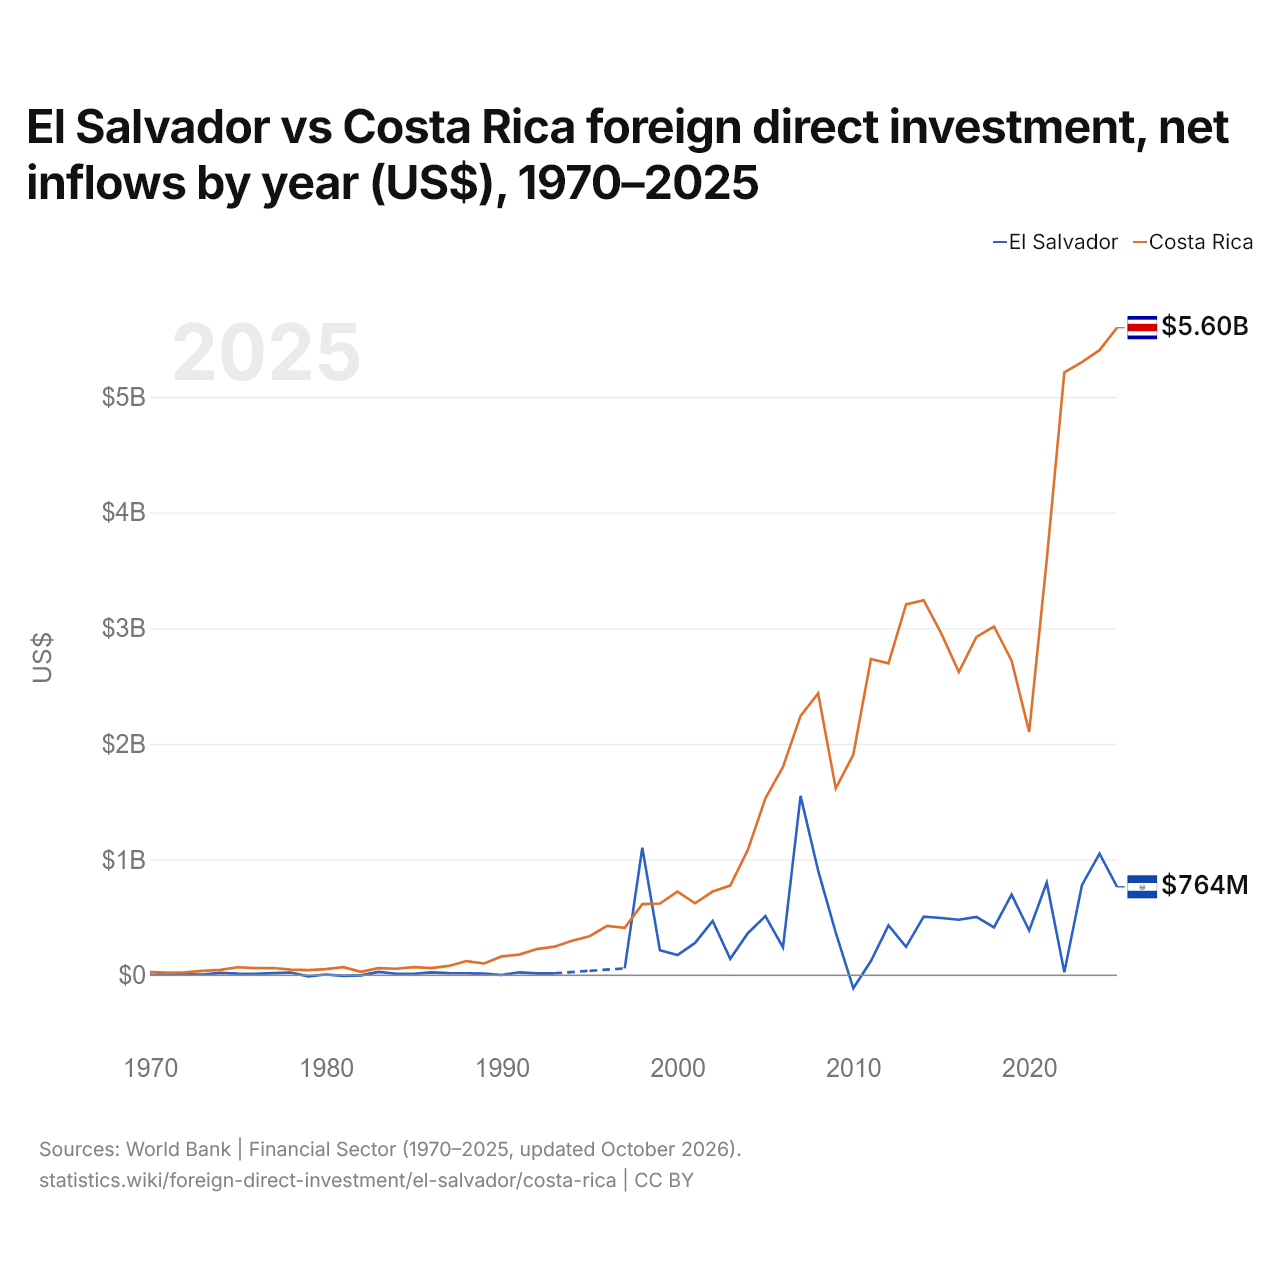
Salvador vs Costa Rica : investissements directs étrangers, entrées nettes par année ($ US), 1970–2025
| Année | $ US | |
|---|---|---|
 Salvador |
 Costa Rica |
|
| 2025 | 763 722 779 $ US | 5 597 399 729 $ US |
| 2024 | 1 050 986 142 $ US | 5 403 432 816 $ US |
| 2023 | 778 284 501 $ US | 5 299 479 758 $ US |
| 2022 | 26 235 087 $ US | 5 211 614 084 $ US |
| 2021 | 800 443 455 $ US | 3 592 802 258 $ US |
| 2020 | 386 532 638 $ US | 2 103 003 649 $ US |
| 2019 | 696 287 033 $ US | 2 719 031 329 $ US |
| 2018 | 412 743 968 $ US | 3 014 543 618 $ US |
| 2017 | 503 801 415 $ US | 2 924 906 991 $ US |
| 2016 | 479 469 381 $ US | 2 620 435 491 $ US |
| 2015 | 494 541 718 $ US | 2 955 521 681 $ US |
| 2014 | 506 295 970 $ US | 3 242 149 797 $ US |
| 2013 | 245 179 098 $ US | 3 205 384 977 $ US |
| 2012 | 430 126 688 $ US | 2 696 295 211 $ US |
| 2011 | 122 500 004 $ US | 2 733 268 840 $ US |
| 2010 | −113 160 684 $ US | 1 906 923 793 $ US |
| 2009 | 368 730 000 $ US | 1 614 614 468 $ US |
| 2008 | 903 050 000 $ US | 2 436 112 218 $ US |
| 2007 | 1 550 510 000 $ US | 2 241 492 021 $ US |
| 2006 | 241 130 000 $ US | 1 801 002 598 $ US |
| 2005 | 511 140 000 $ US | 1 528 787 464 $ US |
| 2004 | 363 270 000 $ US | 1 083 718 486 $ US |
| 2003 | 141 200 000 $ US | 774 386 240 $ US |
| 2002 | 470 000 000 $ US | 723 172 625 $ US |
| 2001 | 278 900 000 $ US | 621 846 413 $ US |
| 2000 | 173 400 000 $ US | 723 426 415 $ US |
| 1999 | 215 800 000 $ US | 619 469 212 $ US |
| 1998 | 1 102 684 180 $ US | 614 500 000 $ US |
| 1997 | 59 043 540 $ US | 409 440 000 $ US |
| 1996 | - | 426 950 000 $ US |
| 1995 | 38 037 219 $ US | 336 900 000 $ US |
| 1994 | - | 297 600 000 $ US |
| 1993 | 16 432 044 $ US | 246 700 000 $ US |
| 1992 | 15 309 479 $ US | 226 000 000 $ US |
| 1991 | 25 180 499 $ US | 178 400 000 $ US |
| 1990 | 1 898 272 $ US | 162 500 000 $ US |
| 1989 | 14 360 000 $ US | 101 300 000 $ US |
| 1988 | 16 960 000 $ US | 122 200 000 $ US |
| 1987 | 18 320 000 $ US | 80 300 000 $ US |
| 1986 | 24 133 631 $ US | 61 000 000 $ US |
| 1985 | 12 400 000 $ US | 69 900 000 $ US |
| 1984 | 12 360 000 $ US | 55 900 000 $ US |
| 1983 | 28 080 000 $ US | 60 700 000 $ US |
| 1982 | −1 000 000 $ US | 28 900 000 $ US |
| 1981 | −5 720 000 $ US | 69 600 000 $ US |
| 1980 | 5 880 000 $ US | 52 600 000 $ US |
| 1979 | −9 960 000 $ US | 43 500 000 $ US |
| 1978 | 23 360 000 $ US | 48 600 000 $ US |
| 1977 | 18 640 000 $ US | 62 500 000 $ US |
| 1976 | 12 960 000 $ US | 61 952 010 $ US |
| 1975 | 13 100 000 $ US | 69 022 010 $ US |
| 1974 | 20 100 000 $ US | 46 310 010 $ US |
| 1973 | 6 000 000 $ US | 37 700 000 $ US |
| 1972 | 6 600 000 $ US | 25 846 010 $ US |
| 1971 | 7 000 000 $ US | 22 100 000 $ US |
| 1970 | 3 700 000 $ US | 26 345 010 $ US |
En 2025, les entrées nettes d'investissements directs étrangers étaient de 764 millions de dollars au Salvador et de 5,6 milliards de dollars au Costa Rica : 7,3 fois plus au Costa Rica. En 1970, elles étaient de 3,7 millions de dollars au Salvador et de 26,3 millions de dollars au Costa Rica.
Les entrées nettes d'investissements directs étrangers au Salvador ont été supérieures à celles du Costa Rica pendant une des 54 années de 1970 à 2025 que les deux pays ont communiquées, et inférieures pendant 53.
Salvador vs Costa Rica : dernières entrées et sorties d'investissements étrangers
|
Salvador
|
Costa Rica
|
|
|---|---|---|
| Entrées nettes | +764 M $US | +5,60 Md $US |
| Entrées nettes, % du PIB | +2,1 % | +5,4 % |
| Sorties nettes | +318 M $US | +384 M $US |
| Entrées nettes, total 2016–2025 | +5,90 Md $US | +38,5 Md $US |
| Rang mondial | 105/192 | 44/192 |
Comparer les investissements directs étrangers de 2 pays au choix
Sources :
- Banque mondiale | Secteur financier (1970–2025, mis à jour en octobre 2026)
Creative Commons Attribution (CC BY) : vous pouvez copier, partager, adapter et réutiliser ce contenu, y compris à des fins commerciales, à condition de citer statistics.wiki et d’indiquer les modifications apportées. Les sources citées ci-dessus peuvent avoir leurs propres conditions de licence.