
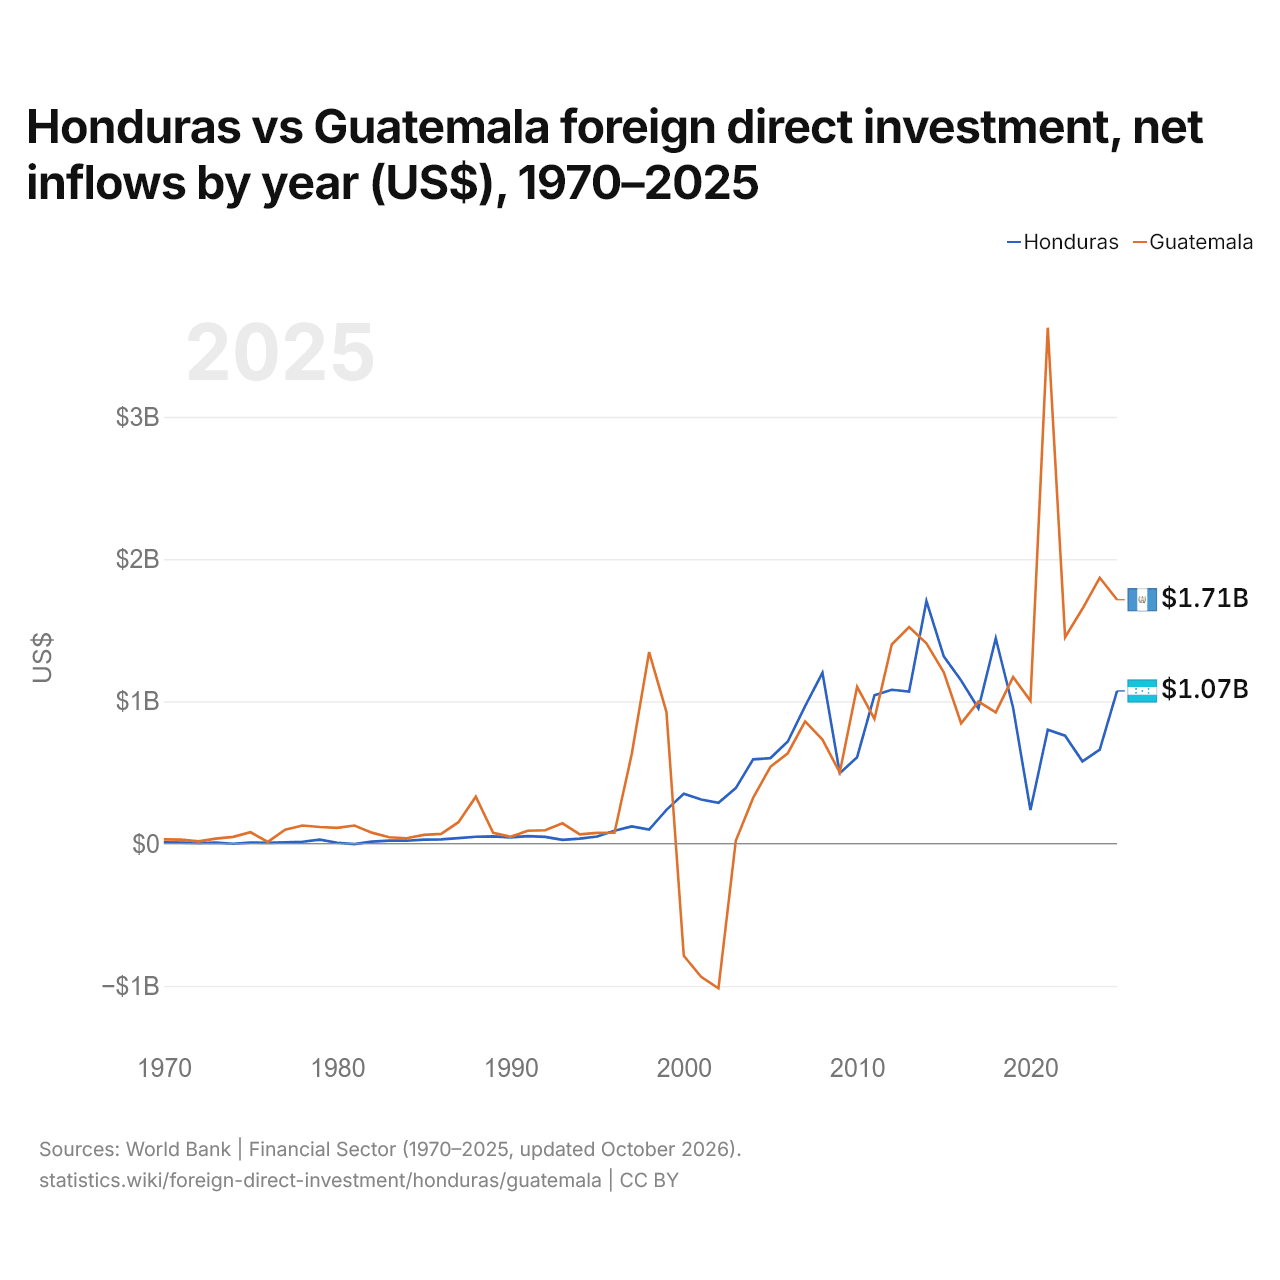
Honduras vs Guatemala : investissements directs étrangers, entrées nettes par année ($ US), 1970–2025
| Année | $ US | |
|---|---|---|
 Honduras |
 Guatemala |
|
| 2025 | 1 072 899 663 $ US | 1 714 293 720 $ US |
| 2024 | 660 724 790 $ US | 1 868 650 070 $ US |
| 2023 | 578 487 315 $ US | 1 650 310 370 $ US |
| 2022 | 758 286 499 $ US | 1 450 072 830 $ US |
| 2021 | 800 315 953 $ US | 3 626 364 530 $ US |
| 2020 | 236 016 866 $ US | 1 004 371 660 $ US |
| 2019 | 955 095 298 $ US | 1 170 758 860 $ US |
| 2018 | 1 442 587 576 $ US | 922 397 870 $ US |
| 2017 | 949 955 942 $ US | 998 344 470 $ US |
| 2016 | 1 147 030 450 $ US | 845 786 560 $ US |
| 2015 | 1 316 679 827 $ US | 1 203 355 080 $ US |
| 2014 | 1 704 790 710 $ US | 1 407 555 280 $ US |
| 2013 | 1 069 029 263 $ US | 1 522 143 500 $ US |
| 2012 | 1 081 346 796 $ US | 1 399 819 890 $ US |
| 2011 | 1 042 571 021 $ US | 876 760 590 $ US |
| 2010 | 607 376 418 $ US | 1 102 460 180 $ US |
| 2009 | 494 497 451 $ US | 499 821 250 $ US |
| 2008 | 1 200 798 087 $ US | 731 386 670 $ US |
| 2007 | 966 926 354 $ US | 859 200 000 $ US |
| 2006 | 717 591 908 $ US | 635 300 000 $ US |
| 2005 | 601 059 572 $ US | 540 000 000 $ US |
| 2004 | 592 120 093 $ US | 321 400 000 $ US |
| 2003 | 390 166 273 $ US | 19 488 618 $ US |
| 2002 | 287 314 900 $ US | −1 016 996 774 $ US |
| 2001 | 309 826 700 $ US | −936 494 410 $ US |
| 2000 | 349 978 000 $ US | −788 600 000 $ US |
| 1999 | 237 300 000 $ US | 924 600 000 $ US |
| 1998 | 99 000 000 $ US | 1 346 300 000 $ US |
| 1997 | 121 500 000 $ US | 631 400 000 $ US |
| 1996 | 90 900 000 $ US | 76 900 000 $ US |
| 1995 | 50 000 000 $ US | 75 200 000 $ US |
| 1994 | 34 800 000 $ US | 65 200 000 $ US |
| 1993 | 26 700 000 $ US | 142 500 000 $ US |
| 1992 | 47 600 000 $ US | 94 100 000 $ US |
| 1991 | 52 100 000 $ US | 90 700 000 $ US |
| 1990 | 43 500 000 $ US | 47 700 000 $ US |
| 1989 | 51 000 000 $ US | 76 200 000 $ US |
| 1988 | 48 300 000 $ US | 329 900 000 $ US |
| 1987 | 38 650 000 $ US | 150 200 000 $ US |
| 1986 | 30 000 000 $ US | 68 800 000 $ US |
| 1985 | 27 500 000 $ US | 61 800 000 $ US |
| 1984 | 20 450 000 $ US | 38 000 000 $ US |
| 1983 | 21 000 000 $ US | 45 000 000 $ US |
| 1982 | 13 800 000 $ US | 77 100 000 $ US |
| 1981 | −3 600 000 $ US | 127 100 000 $ US |
| 1980 | 5 800 000 $ US | 110 700 000 $ US |
| 1979 | 28 200 000 $ US | 117 000 000 $ US |
| 1978 | 13 150 000 $ US | 127 200 000 $ US |
| 1977 | 8 900 000 $ US | 97 500 000 $ US |
| 1976 | 5 250 000 $ US | 12 500 000 $ US |
| 1975 | 7 000 000 $ US | 80 000 000 $ US |
| 1974 | −1 150 000 $ US | 47 400 000 $ US |
| 1973 | 6 600 000 $ US | 34 800 000 $ US |
| 1972 | 3 000 000 $ US | 15 900 000 $ US |
| 1971 | 7 400 000 $ US | 28 600 000 $ US |
| 1970 | 8 400 000 $ US | 29 400 000 $ US |
En 2025, les entrées nettes d'investissements directs étrangers étaient de 1,07 milliard de dollars au Honduras et de 1,71 milliard de dollars au Guatemala : 1,6 fois plus au Guatemala. En 1970, elles étaient de 8,4 millions de dollars au Honduras et de 29,4 millions de dollars au Guatemala.
Les entrées nettes d'investissements directs étrangers au Honduras ont été supérieures à celles du Guatemala pendant 15 des 56 années de 1970 à 2025, et inférieures pendant 41.
Honduras vs Guatemala : dernières entrées et sorties d'investissements étrangers
|
Honduras
|
Guatemala
|
|
|---|---|---|
| Entrées nettes | +1,07 Md $US | +1,71 Md $US |
| Entrées nettes, % du PIB | +2,7 % | +1,4 % |
| Sorties nettes | +284 M $US | +2,34 Md $US |
| Entrées nettes, total 2016–2025 | +8,60 Md $US | +15,3 Md $US |
| Rang mondial | 90/192 | 75/192 |
Comparer les investissements directs étrangers de 2 pays au choix
Sources :
- Banque mondiale | Secteur financier (1970–2025, mis à jour en octobre 2026)
Creative Commons Attribution (CC BY) : vous pouvez copier, partager, adapter et réutiliser ce contenu, y compris à des fins commerciales, à condition de citer statistics.wiki et d’indiquer les modifications apportées. Les sources citées ci-dessus peuvent avoir leurs propres conditions de licence.