
Sierra Leone vs Côte d’Ivoire : PIB, 1960–2025
| Année | PIB, dollars US courants | |
|---|---|---|
 Sierra Leone |
 Côte d’Ivoire |
|
| 2025 | 7 464 157 904 $ US | 99 773 555 666 $ US |
| 2024 | 6 971 127 234 $ US | 87 113 179 149 $ US |
| 2023 | 6 415 852 766 $ US | 80 780 312 569 $ US |
| 2022 | 7 121 125 277 $ US | 70 922 824 814 $ US |
| 2021 | 7 166 931 483 $ US | 72 794 636 654 $ US |
| 2020 | 6 688 307 706 $ US | 63 027 852 805 $ US |
| 2019 | 6 523 577 590 $ US | 60 382 894 697 $ US |
| 2018 | 6 390 514 689 $ US | 58 522 477 787 $ US |
| 2017 | 5 749 846 528 $ US | 52 512 343 997 $ US |
| 2016 | 6 084 297 211 $ US | 48 407 761 037 $ US |
| 2015 | 6 788 352 975 $ US | 45 815 005 169 $ US |
| 2014 | 7 686 138 791 $ US | 48 843 005 614 $ US |
| 2013 | 7 502 762 863 $ US | 42 760 235 485 $ US |
| 2012 | 6 141 666 509 $ US | 36 302 302 877 $ US |
| 2011 | 4 861 632 885 $ US | 36 693 710 801 $ US |
| 2010 | 4 262 805 967 $ US | 34 936 307 980 $ US |
| 2009 | 3 953 403 098 $ US | 33 886 813 250 $ US |
| 2008 | 4 157 895 298 $ US | 34 078 240 293 $ US |
| 2007 | 3 632 957 611 $ US | 28 760 090 953 $ US |
| 2006 | 3 263 697 467 $ US | 25 281 413 263 $ US |
| 2005 | 2 545 275 313 $ US | 24 036 918 703 $ US |
| 2004 | 2 237 350 687 $ US | 23 510 575 681 $ US |
| 2003 | 2 142 618 046 $ US | 21 251 754 340 $ US |
| 2002 | 1 933 863 911 $ US | 18 054 383 321 $ US |
| 2001 | 1 681 473 894 $ US | 16 810 537 044 $ US |
| 2000 | 635 866 404 $ US | 16 577 533 892 $ US |
| 1999 | 669 386 624 $ US | 18 870 992 456 $ US |
| 1998 | 672 368 187 $ US | 19 619 654 756 $ US |
| 1997 | 850 232 760 $ US | 18 047 558 038 $ US |
| 1996 | 941 709 423 $ US | 18 071 152 831 $ US |
| 1995 | 870 740 292 $ US | 11 000 146 267 $ US |
| 1994 | 911 853 802 $ US | 8 313 557 510 $ US |
| 1993 | 768 867 883 $ US | 11 045 760 288 $ US |
| 1992 | 679 940 814 $ US | 11 152 971 274 $ US |
| 1991 | 779 981 987 $ US | 10 492 628 581 $ US |
| 1990 | 649 644 098 $ US | 10 795 850 583 $ US |
| 1989 | 932 974 420 $ US | 9 757 410 645 $ US |
| 1988 | 1 055 083 933 $ US | 10 255 169 806 $ US |
| 1987 | 660 106 336 $ US | 10 087 654 465 $ US |
| 1986 | 490 181 457 $ US | 9 158 302 100 $ US |
| 1985 | 856 890 459 $ US | 6 977 650 644 $ US |
| 1984 | 1 087 471 862 $ US | 6 841 639 247 $ US |
| 1983 | 995 104 305 $ US | 6 838 184 773 $ US |
| 1982 | 1 295 361 886 $ US | 7 567 110 849 $ US |
| 1981 | 1 114 830 472 $ US | 8 432 589 942 $ US |
| 1980 | 1 100 685 845 $ US | 10 175 617 609 $ US |
| 1979 | 1 109 374 911 $ US | 9 142 933 967 $ US |
| 1978 | 960 728 339 $ US | 7 900 526 298 $ US |
| 1977 | 691 777 584 $ US | 6 265 068 189 $ US |
| 1976 | 594 895 942 $ US | 4 662 053 825 $ US |
| 1975 | 679 336 344 $ US | 3 893 839 190 $ US |
| 1974 | 648 590 643 $ US | 3 070 152 309 $ US |
| 1973 | 575 230 724 $ US | 2 508 421 426 $ US |
| 1972 | 465 381 340 $ US | 1 849 400 402 $ US |
| 1971 | 419 549 305 $ US | 1 584 128 509 $ US |
| 1970 | 434 410 974 $ US | 1 455 482 795 $ US |
| 1969 | 408 690 163 $ US | 1 361 360 293 $ US |
| 1968 | 329 859 732 $ US | 1 281 281 277 $ US |
| 1967 | 348 795 303 $ US | 1 082 922 725 $ US |
| 1966 | 375 479 850 $ US | 1 024 102 880 $ US |
| 1965 | 359 379 856 $ US | 919 771 229 $ US |
| 1964 | 371 847 461 $ US | 921 063 327 $ US |
| 1963 | 348 547 279 $ US | 761 047 198 $ US |
| 1962 | 342 721 416 $ US | 645 284 474 $ US |
| 1961 | 327 834 191 $ US | 618 245 634 $ US |
| 1960 | 322 009 962 $ US | 546 203 559 $ US |
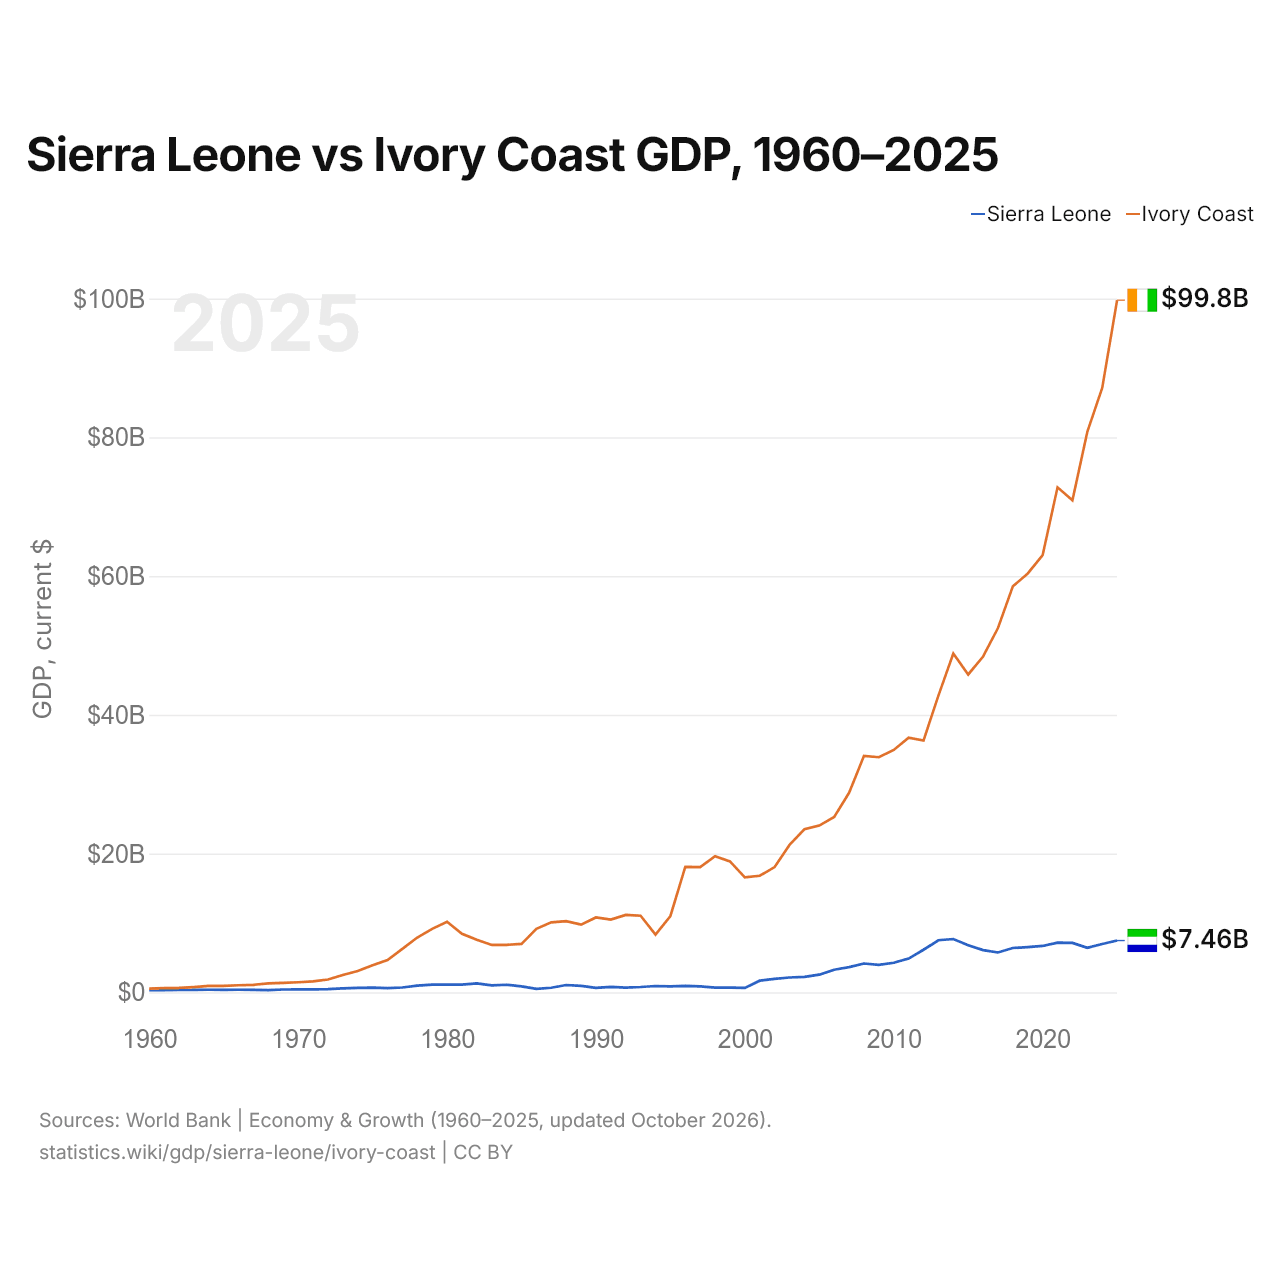
En 2025, le PIB de la Côte d’Ivoire (99,8 milliards de dollars US) était 13 fois celui de la Sierra Leone (7,46 milliards de dollars US). En 2015, le rapport était de 6,7. De 2015 à 2025, à prix constants de 2015, le PIB de la Côte d’Ivoire a progressé de 77,8 % et celui de la Sierra Leone de 51,5 %.
Depuis 1960, le PIB de la Côte d’Ivoire a chaque année été le plus élevé des deux ; en 1960, il était 1,7 fois celui de la Sierra Leone. En 2025, le PIB par habitant était de 846 $ US en Sierra Leone et de 3 050 $ US en Côte d’Ivoire, soit 3,6 fois plus élevé en Côte d’Ivoire.
Sierra Leone vs Côte d’Ivoire : derniers chiffres du PIB
|
Sierra Leone
|
Côte d’Ivoire
|
|
|---|---|---|
| PIB, dollars US courants | 7,46 Md $US | 99,8 Md $US |
| Rang mondial | 160/197 | 77/197 |
| Part mondiale | 0,006 % | 0,08 % |
| PIB, dollars US constants de 2015 | 10,3 Md $US | 81,5 Md $US |
| Écart de PIB | 0,075× | 13× |
Comparer le PIB de 2 pays au choix
Sources :
- Banque mondiale | Économie et croissance (1960–2025, mis à jour en octobre 2026)
Creative Commons Attribution (CC BY) : vous pouvez copier, partager, adapter et réutiliser ce contenu, y compris à des fins commerciales, à condition de citer statistics.wiki et d’indiquer les modifications apportées. Les sources citées ci-dessus peuvent avoir leurs propres conditions de licence.