
Mali vs Côte d’Ivoire : PIB, 1960–2025
| Année | PIB, dollars US courants | |
|---|---|---|
 Mali |
 Côte d’Ivoire |
|
| 2025 | 30 069 148 581 $ US | 99 773 555 666 $ US |
| 2024 | 26 761 281 077 $ US | 87 113 179 149 $ US |
| 2023 | 24 777 941 861 $ US | 80 780 312 569 $ US |
| 2022 | 22 539 987 719 $ US | 70 922 824 814 $ US |
| 2021 | 22 999 245 263 $ US | 72 794 636 654 $ US |
| 2020 | 20 698 560 939 $ US | 63 027 852 805 $ US |
| 2019 | 20 477 421 885 $ US | 60 382 894 697 $ US |
| 2018 | 20 368 015 381 $ US | 58 522 477 787 $ US |
| 2017 | 18 308 362 040 $ US | 52 512 343 997 $ US |
| 2016 | 16 743 796 800 $ US | 48 407 761 037 $ US |
| 2015 | 15 583 181 170 $ US | 45 815 005 169 $ US |
| 2014 | 17 081 681 993 $ US | 48 843 005 614 $ US |
| 2013 | 15 747 192 681 $ US | 42 760 235 485 $ US |
| 2012 | 14 795 114 603 $ US | 36 302 302 877 $ US |
| 2011 | 15 452 791 789 $ US | 36 693 710 801 $ US |
| 2010 | 12 710 739 160 $ US | 34 936 307 980 $ US |
| 2009 | 12 155 217 833 $ US | 33 886 813 250 $ US |
| 2008 | 11 462 490 840 $ US | 34 078 240 293 $ US |
| 2007 | 9 699 047 443 $ US | 28 760 090 953 $ US |
| 2006 | 8 212 007 554 $ US | 25 281 413 263 $ US |
| 2005 | 7 429 066 952 $ US | 24 036 918 703 $ US |
| 2004 | 6 485 774 930 $ US | 23 510 575 681 $ US |
| 2003 | 5 605 613 011 $ US | 21 251 754 340 $ US |
| 2002 | 4 647 238 257 $ US | 18 054 383 321 $ US |
| 2001 | 4 124 281 594 $ US | 16 810 537 044 $ US |
| 2000 | 3 521 570 876 $ US | 16 577 533 892 $ US |
| 1999 | 4 091 446 054 $ US | 18 870 992 456 $ US |
| 1998 | 3 894 433 432 $ US | 19 619 654 756 $ US |
| 1997 | 3 414 879 486 $ US | 18 047 558 038 $ US |
| 1996 | 3 743 103 420 $ US | 18 071 152 831 $ US |
| 1995 | 3 373 322 735 $ US | 11 000 146 267 $ US |
| 1994 | 2 655 768 636 $ US | 8 313 557 510 $ US |
| 1993 | 3 632 801 877 $ US | 11 045 760 288 $ US |
| 1992 | 3 680 775 037 $ US | 11 152 971 274 $ US |
| 1991 | 3 576 562 682 $ US | 10 492 628 581 $ US |
| 1990 | 3 248 417 791 $ US | 10 795 850 583 $ US |
| 1989 | 2 824 822 489 $ US | 9 757 410 645 $ US |
| 1988 | 2 712 207 901 $ US | 10 255 169 806 $ US |
| 1987 | 2 437 004 680 $ US | 10 087 654 465 $ US |
| 1986 | 2 132 938 007 $ US | 9 158 302 100 $ US |
| 1985 | 1 594 347 021 $ US | 6 977 650 644 $ US |
| 1984 | 1 387 809 615 $ US | 6 841 639 247 $ US |
| 1983 | 1 496 616 127 $ US | 6 838 184 773 $ US |
| 1982 | 1 680 304 773 $ US | 7 567 110 849 $ US |
| 1981 | 2 234 583 940 $ US | 8 432 589 942 $ US |
| 1980 | 2 704 362 789 $ US | 10 175 617 609 $ US |
| 1979 | 1 595 422 956 $ US | 9 142 933 967 $ US |
| 1978 | 1 222 702 573 $ US | 7 900 526 298 $ US |
| 1977 | 1 049 838 548 $ US | 6 265 068 189 $ US |
| 1976 | 939 228 017 $ US | 4 662 053 825 $ US |
| 1975 | 830 710 615 $ US | 3 893 839 190 $ US |
| 1974 | 538 747 340 $ US | 3 070 152 309 $ US |
| 1973 | 563 683 703 $ US | 2 508 421 426 $ US |
| 1972 | 486 617 280 $ US | 1 849 400 402 $ US |
| 1971 | 395 218 629 $ US | 1 584 128 509 $ US |
| 1970 | 359 772 315 $ US | 1 455 482 795 $ US |
| 1969 | 339 913 867 $ US | 1 361 360 293 $ US |
| 1968 | 343 771 973 $ US | 1 281 281 277 $ US |
| 1967 | 275 494 478 $ US | 1 082 922 725 $ US |
| 1966 | - | 1 024 102 880 $ US |
| 1965 | - | 919 771 229 $ US |
| 1964 | - | 921 063 327 $ US |
| 1963 | - | 761 047 198 $ US |
| 1962 | - | 645 284 474 $ US |
| 1961 | - | 618 245 634 $ US |
| 1960 | - | 546 203 559 $ US |
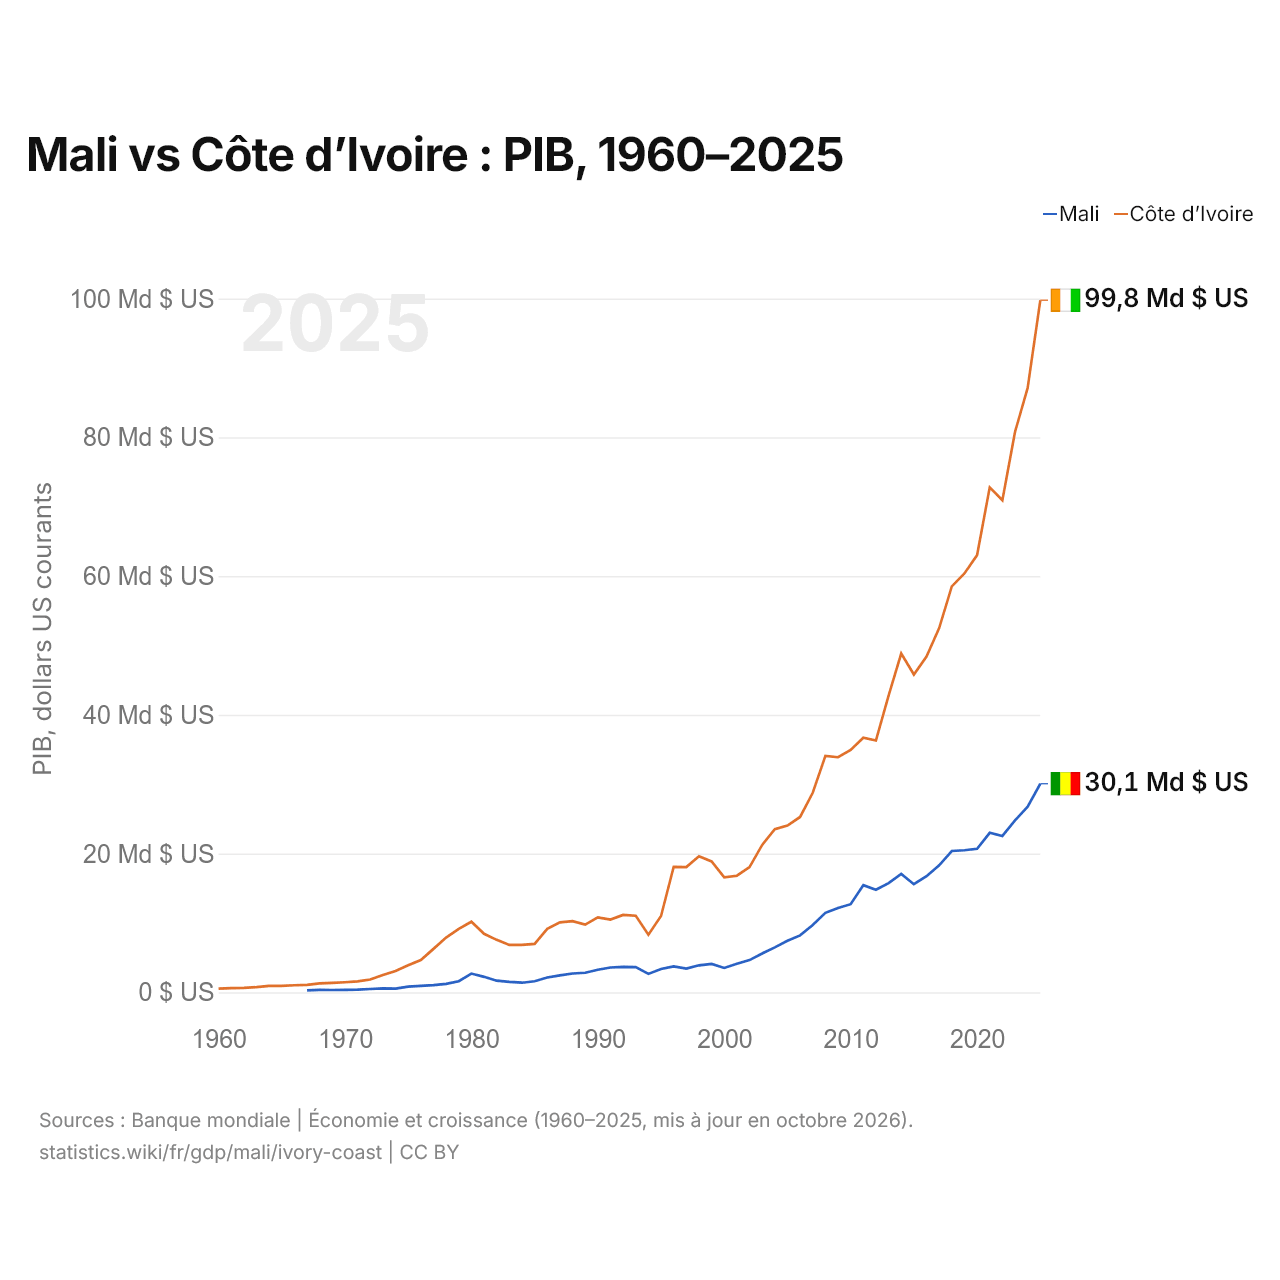
En 2025, le PIB de la Côte d’Ivoire (99,8 milliards de dollars US) était 3,3 fois celui du Mali (30,1 milliards de dollars US). En 2015, le rapport était de 2,9. De 2015 à 2025, à prix constants de 2015, le PIB de la Côte d’Ivoire a progressé de 77,8 % et celui du Mali de 51,0 %.
Depuis 1967, le PIB de la Côte d’Ivoire a chaque année été le plus élevé des deux ; en 1967, il était 3,9 fois celui du Mali. En 2025, le PIB par habitant était de 1 193 $ US au Mali et de 3 050 $ US en Côte d’Ivoire, soit 2,6 fois plus élevé en Côte d’Ivoire.
Mali vs Côte d’Ivoire : derniers chiffres du PIB
|
Mali
|
Côte d’Ivoire
|
|
|---|---|---|
| PIB, dollars US courants | 30,1 Md $US | 99,8 Md $US |
| Rang mondial | 114/197 | 77/197 |
| Part mondiale | 0,03 % | 0,08 % |
| PIB, dollars US constants de 2015 | 23,5 Md $US | 81,5 Md $US |
| Écart de PIB | 0,3× | 3,3× |
Comparer le PIB de 2 pays au choix
Sources :
- Banque mondiale | Économie et croissance (1960–2025, mis à jour en octobre 2026)
Creative Commons Attribution (CC BY) : vous pouvez copier, partager, adapter et réutiliser ce contenu, y compris à des fins commerciales, à condition de citer statistics.wiki et d’indiquer les modifications apportées. Les sources citées ci-dessus peuvent avoir leurs propres conditions de licence.