
Russie vs Côte d’Ivoire : PIB, 1960–2025
| Année | PIB, dollars US courants | |
|---|---|---|
 Russie |
 Côte d’Ivoire |
|
| 2025 | 2 561 310 169 359 $ US | 99 773 555 666 $ US |
| 2024 | 2 186 462 268 813 $ US | 87 113 179 149 $ US |
| 2023 | 2 046 284 838 151 $ US | 80 780 312 569 $ US |
| 2022 | 2 292 495 097 681 $ US | 70 922 824 814 $ US |
| 2021 | 1 829 186 719 575 $ US | 72 794 636 654 $ US |
| 2020 | 1 493 075 894 362 $ US | 63 027 852 805 $ US |
| 2019 | 1 693 115 002 708 $ US | 60 382 894 697 $ US |
| 2018 | 1 657 328 773 461 $ US | 58 522 477 787 $ US |
| 2017 | 1 574 199 360 089 $ US | 52 512 343 997 $ US |
| 2016 | 1 276 786 350 881 $ US | 48 407 761 037 $ US |
| 2015 | 1 363 482 182 198 $ US | 45 815 005 169 $ US |
| 2014 | 2 059 241 589 895 $ US | 48 843 005 614 $ US |
| 2013 | 2 292 470 078 346 $ US | 42 760 235 485 $ US |
| 2012 | 2 208 293 553 878 $ US | 36 302 302 877 $ US |
| 2011 | 2 045 922 753 398 $ US | 36 693 710 801 $ US |
| 2010 | 1 524 916 715 224 $ US | 34 936 307 980 $ US |
| 2009 | 1 222 645 900 056 $ US | 33 886 813 250 $ US |
| 2008 | 1 660 848 058 303 $ US | 34 078 240 293 $ US |
| 2007 | 1 299 703 478 482 $ US | 28 760 090 953 $ US |
| 2006 | 989 932 071 353 $ US | 25 281 413 263 $ US |
| 2005 | 764 015 973 481 $ US | 24 036 918 703 $ US |
| 2004 | 591 016 690 732 $ US | 23 510 575 681 $ US |
| 2003 | 430 347 420 185 $ US | 21 251 754 340 $ US |
| 2002 | 345 470 494 418 $ US | 18 054 383 321 $ US |
| 2001 | 306 602 070 621 $ US | 16 810 537 044 $ US |
| 2000 | 259 710 142 197 $ US | 16 577 533 892 $ US |
| 1999 | 195 907 128 351 $ US | 18 870 992 456 $ US |
| 1998 | 270 955 486 862 $ US | 19 619 654 756 $ US |
| 1997 | 404 928 954 192 $ US | 18 047 558 038 $ US |
| 1996 | 391 724 890 744 $ US | 18 071 152 831 $ US |
| 1995 | 395 537 185 735 $ US | 11 000 146 267 $ US |
| 1994 | 395 077 301 248 $ US | 8 313 557 510 $ US |
| 1993 | 435 083 713 851 $ US | 11 045 760 288 $ US |
| 1992 | 460 290 556 901 $ US | 11 152 971 274 $ US |
| 1991 | 517 962 962 963 $ US | 10 492 628 581 $ US |
| 1990 | 517 014 446 228 $ US | 10 795 850 583 $ US |
| 1989 | 506 631 299 735 $ US | 9 757 410 645 $ US |
| 1988 | 554 828 660 436 $ US | 10 255 169 806 $ US |
| 1987 | - | 10 087 654 465 $ US |
| 1986 | - | 9 158 302 100 $ US |
| 1985 | - | 6 977 650 644 $ US |
| 1984 | - | 6 841 639 247 $ US |
| 1983 | - | 6 838 184 773 $ US |
| 1982 | - | 7 567 110 849 $ US |
| 1981 | - | 8 432 589 942 $ US |
| 1980 | - | 10 175 617 609 $ US |
| 1979 | - | 9 142 933 967 $ US |
| 1978 | - | 7 900 526 298 $ US |
| 1977 | - | 6 265 068 189 $ US |
| 1976 | - | 4 662 053 825 $ US |
| 1975 | - | 3 893 839 190 $ US |
| 1974 | - | 3 070 152 309 $ US |
| 1973 | - | 2 508 421 426 $ US |
| 1972 | - | 1 849 400 402 $ US |
| 1971 | - | 1 584 128 509 $ US |
| 1970 | - | 1 455 482 795 $ US |
| 1969 | - | 1 361 360 293 $ US |
| 1968 | - | 1 281 281 277 $ US |
| 1967 | - | 1 082 922 725 $ US |
| 1966 | - | 1 024 102 880 $ US |
| 1965 | - | 919 771 229 $ US |
| 1964 | - | 921 063 327 $ US |
| 1963 | - | 761 047 198 $ US |
| 1962 | - | 645 284 474 $ US |
| 1961 | - | 618 245 634 $ US |
| 1960 | - | 546 203 559 $ US |
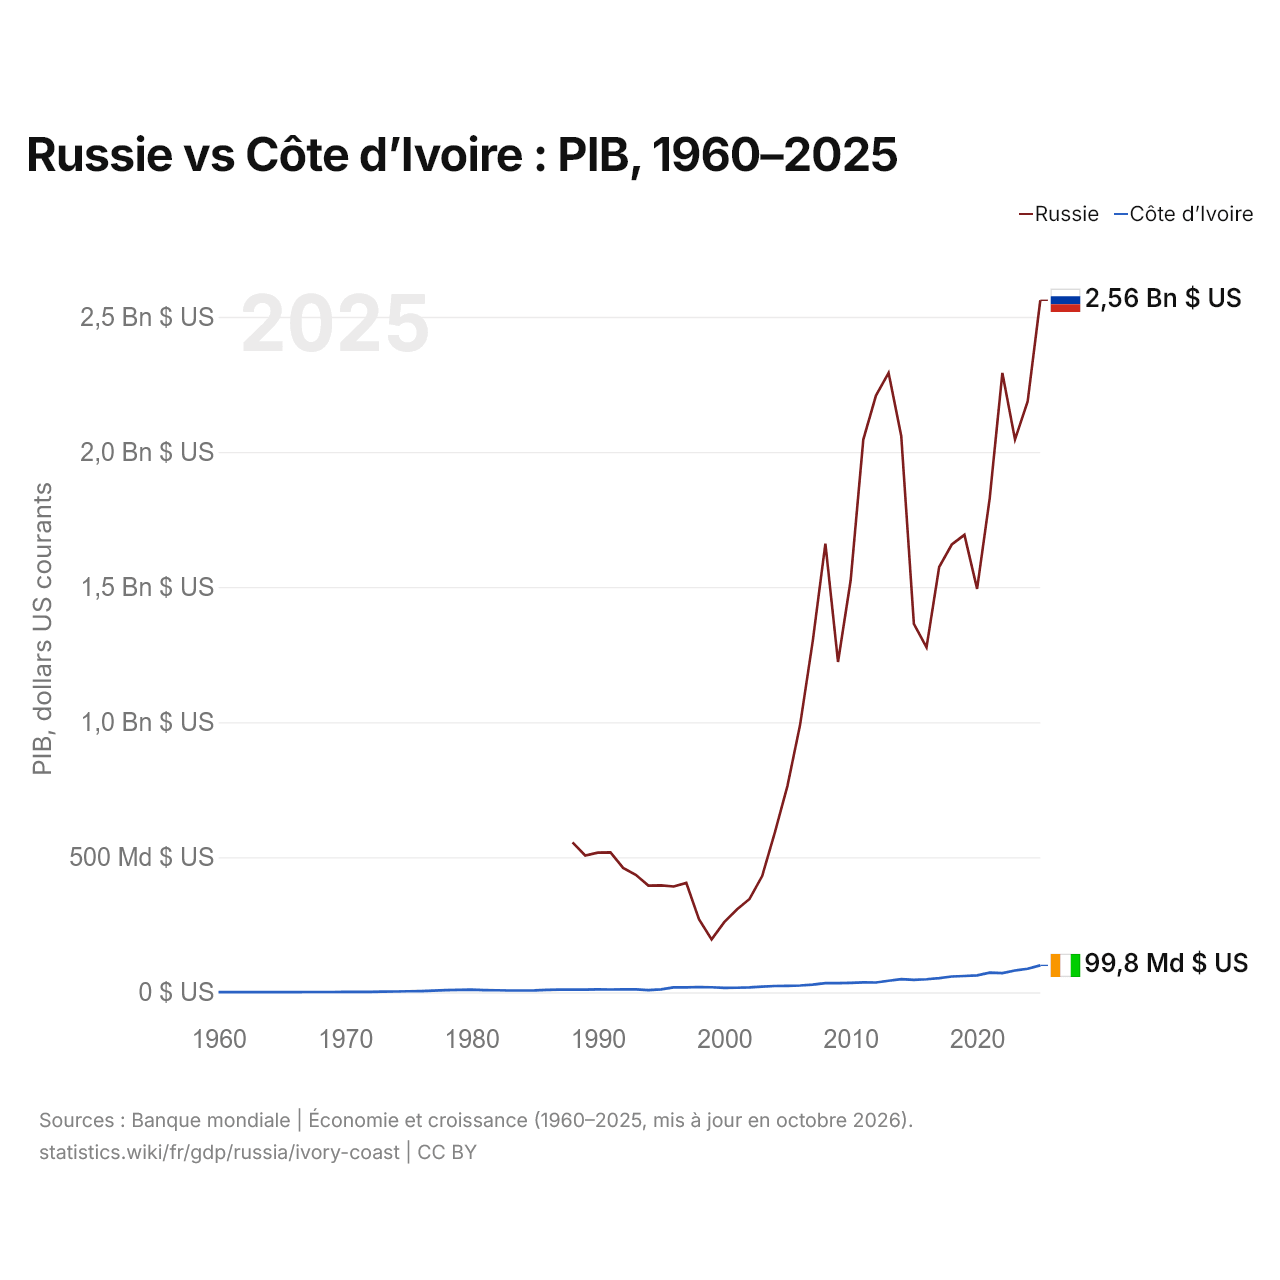
En 2025, le PIB de la Russie (2,56 billions de dollars US) était 26 fois celui de la Côte d’Ivoire (99,8 milliards de dollars US). En 2015, le rapport était de 30. De 2015 à 2025, à prix constants de 2015, le PIB de la Russie a progressé de 20,1 % et celui de la Côte d’Ivoire de 77,8 %.
Depuis 1988, le PIB de la Russie a chaque année été le plus élevé des deux ; en 1988, il était 54 fois celui de la Côte d’Ivoire. En 2025, le PIB par habitant était de 17 847 $ US en Russie et de 3 050 $ US en Côte d’Ivoire, soit 5,9 fois plus élevé en Russie.
Russie vs Côte d’Ivoire : derniers chiffres du PIB
|
Russie
|
Côte d’Ivoire
|
|
|---|---|---|
| PIB, dollars US courants | 2,56 Bn $US | 99,8 Md $US |
| Rang mondial | 8/197 | 77/197 |
| Part mondiale | 2,16 % | 0,08 % |
| PIB, dollars US constants de 2015 | 1,64 Bn $US | 81,5 Md $US |
| Écart de PIB | 26× | 0,039× |
Comparer le PIB de 2 pays au choix
Sources :
- Banque mondiale | Économie et croissance (1960–2025, mis à jour en octobre 2026)
Creative Commons Attribution (CC BY) : vous pouvez copier, partager, adapter et réutiliser ce contenu, y compris à des fins commerciales, à condition de citer statistics.wiki et d’indiquer les modifications apportées. Les sources citées ci-dessus peuvent avoir leurs propres conditions de licence.