
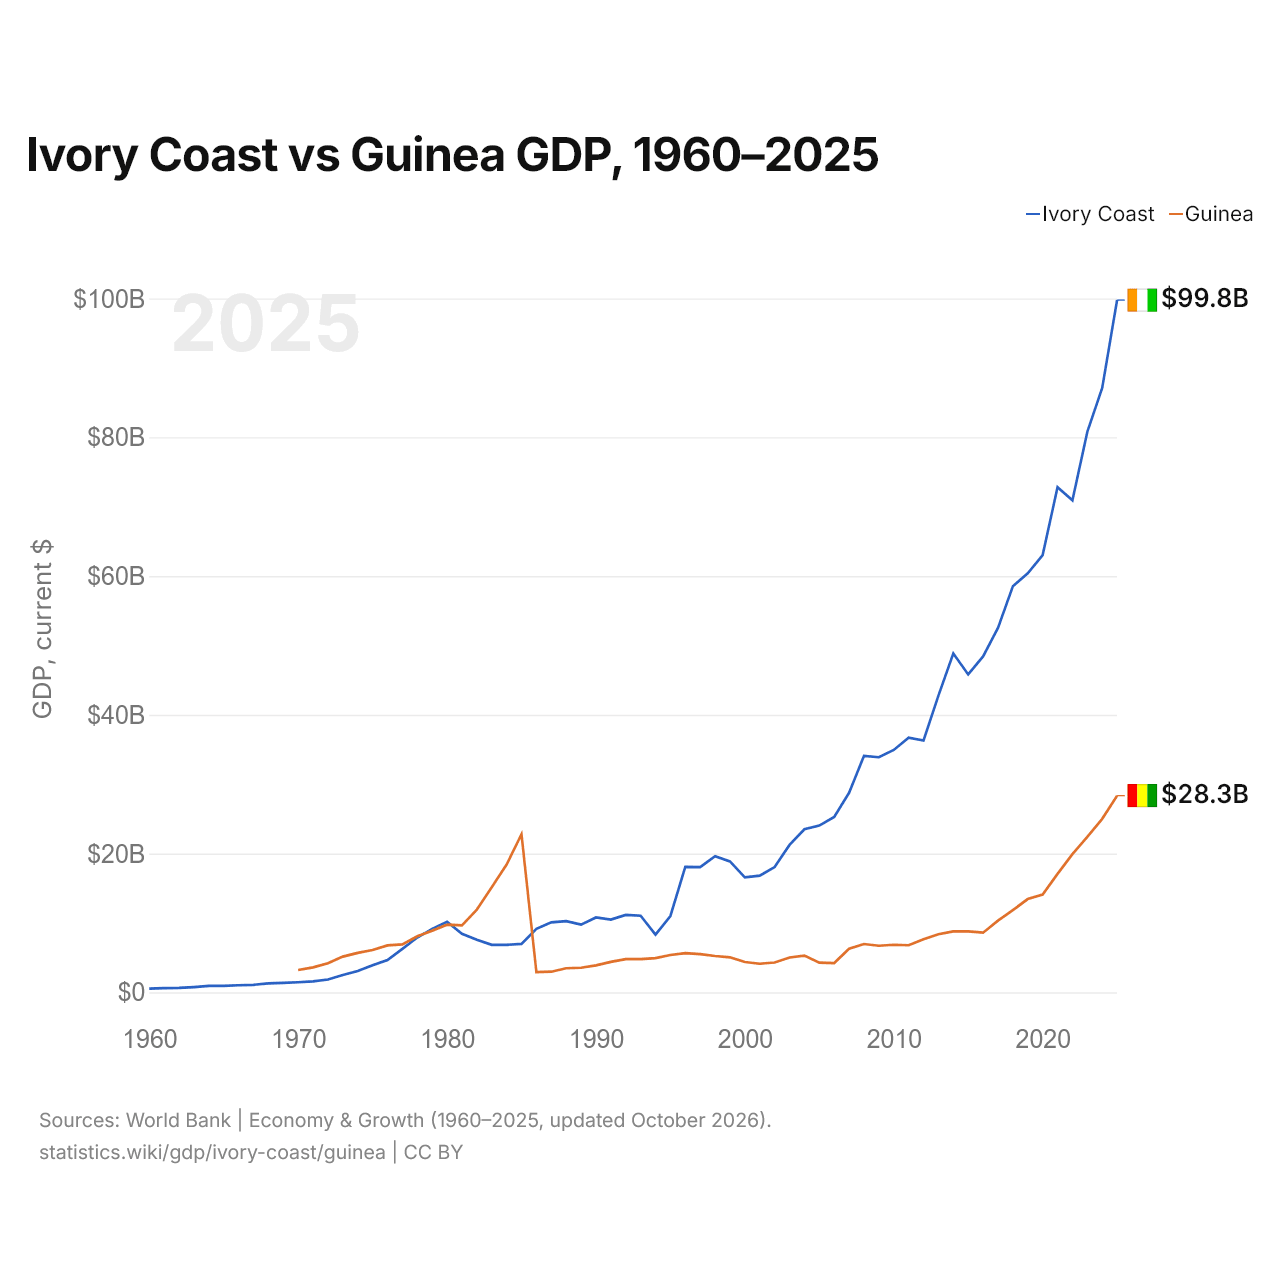
Côte d’Ivoire vs Guinée : PIB, 1960–2025
| Année | PIB, dollars US courants | |
|---|---|---|
 Côte d’Ivoire |
 Guinée |
|
| 2025 | 99 773 555 666 $ US | 28 346 024 753 $ US |
| 2024 | 87 113 179 149 $ US | 25 008 678 293 $ US |
| 2023 | 80 780 312 569 $ US | 22 407 615 556 $ US |
| 2022 | 70 922 824 814 $ US | 19 910 452 542 $ US |
| 2021 | 72 794 636 654 $ US | 17 069 115 738 $ US |
| 2020 | 63 027 852 805 $ US | 14 088 693 743 $ US |
| 2019 | 60 382 894 697 $ US | 13 442 861 496 $ US |
| 2018 | 58 522 477 787 $ US | 11 857 030 367 $ US |
| 2017 | 52 512 343 997 $ US | 10 324 668 271 $ US |
| 2016 | 48 407 761 037 $ US | 8 595 955 222 $ US |
| 2015 | 45 815 005 169 $ US | 8 794 201 743 $ US |
| 2014 | 48 843 005 614 $ US | 8 778 473 373 $ US |
| 2013 | 42 760 235 485 $ US | 8 376 613 539 $ US |
| 2012 | 36 302 302 877 $ US | 7 638 044 557 $ US |
| 2011 | 36 693 710 801 $ US | 6 785 137 203 $ US |
| 2010 | 34 936 307 980 $ US | 6 853 467 146 $ US |
| 2009 | 33 886 813 250 $ US | 6 716 905 340 $ US |
| 2008 | 34 078 240 293 $ US | 6 964 179 983 $ US |
| 2007 | 28 760 090 953 $ US | 6 281 918 226 $ US |
| 2006 | 25 281 413 263 $ US | 4 220 019 845 $ US |
| 2005 | 24 036 918 703 $ US | 4 282 468 637 $ US |
| 2004 | 23 510 575 681 $ US | 5 300 767 961 $ US |
| 2003 | 21 251 754 340 $ US | 5 025 167 975 $ US |
| 2002 | 18 054 383 321 $ US | 4 301 608 753 $ US |
| 2001 | 16 810 537 044 $ US | 4 125 527 603 $ US |
| 2000 | 16 577 533 892 $ US | 4 367 458 867 $ US |
| 1999 | 18 870 992 456 $ US | 5 046 806 783 $ US |
| 1998 | 19 619 654 756 $ US | 5 232 118 046 $ US |
| 1997 | 18 047 558 038 $ US | 5 516 916 163 $ US |
| 1996 | 18 071 152 831 $ US | 5 641 243 100 $ US |
| 1995 | 11 000 146 267 $ US | 5 385 704 166 $ US |
| 1994 | 8 313 557 510 $ US | 4 932 800 407 $ US |
| 1993 | 11 045 760 288 $ US | 4 781 166 117 $ US |
| 1992 | 11 152 971 274 $ US | 4 789 220 417 $ US |
| 1991 | 10 492 628 581 $ US | 4 396 178 694 $ US |
| 1990 | 10 795 850 583 $ US | 3 888 320 666 $ US |
| 1989 | 9 757 410 645 $ US | 3 546 079 263 $ US |
| 1988 | 10 255 169 806 $ US | 3 476 480 303 $ US |
| 1987 | 10 087 654 465 $ US | 2 976 714 019 $ US |
| 1986 | 9 158 302 100 $ US | 2 909 130 355 $ US |
| 1985 | 6 977 650 644 $ US | 22 787 644 566 $ US |
| 1984 | 6 841 639 247 $ US | 18 421 497 251 $ US |
| 1983 | 6 838 184 773 $ US | 15 129 893 722 $ US |
| 1982 | 7 567 110 849 $ US | 11 926 032 493 $ US |
| 1981 | 8 432 589 942 $ US | 9 646 440 667 $ US |
| 1980 | 10 175 617 609 $ US | 9 746 524 915 $ US |
| 1979 | 9 142 933 967 $ US | 8 877 094 497 $ US |
| 1978 | 7 900 526 298 $ US | 8 087 305 999 $ US |
| 1977 | 6 265 068 189 $ US | 6 914 381 291 $ US |
| 1976 | 4 662 053 825 $ US | 6 762 781 871 $ US |
| 1975 | 3 893 839 190 $ US | 6 102 769 605 $ US |
| 1974 | 3 070 152 309 $ US | 5 691 417 541 $ US |
| 1973 | 2 508 421 426 $ US | 5 152 080 388 $ US |
| 1972 | 1 849 400 402 $ US | 4 203 069 035 $ US |
| 1971 | 1 584 128 509 $ US | 3 594 302 908 $ US |
| 1970 | 1 455 482 795 $ US | 3 220 224 608 $ US |
| 1969 | 1 361 360 293 $ US | - |
| 1968 | 1 281 281 277 $ US | - |
| 1967 | 1 082 922 725 $ US | - |
| 1966 | 1 024 102 880 $ US | - |
| 1965 | 919 771 229 $ US | - |
| 1964 | 921 063 327 $ US | - |
| 1963 | 761 047 198 $ US | - |
| 1962 | 645 284 474 $ US | - |
| 1961 | 618 245 634 $ US | - |
| 1960 | 546 203 559 $ US | - |
En 2025, le PIB de la Côte d’Ivoire (99,8 milliards de dollars US) était 3,5 fois celui de la Guinée (28,3 milliards de dollars US). En 2015, le rapport était de 5,2. De 2015 à 2025, à prix constants de 2015, le PIB de la Côte d’Ivoire a progressé de 77,8 % et celui de la Guinée de 88,6 %.
Depuis 1986, le PIB de la Côte d’Ivoire est le plus élevé des deux ; en 1970, celui de la Guinée était 2,2 fois celui de la Côte d’Ivoire. En 2025, le PIB par habitant était de 3 050 $ US en Côte d’Ivoire et de 1 877 $ US en Guinée, soit 1,6 fois plus élevé en Côte d’Ivoire.
Côte d’Ivoire vs Guinée : derniers chiffres du PIB
|
Côte d’Ivoire
|
Guinée
|
|
|---|---|---|
| PIB, dollars US courants | 99,8 Md $US | 28,3 Md $US |
| Rang mondial | 77/197 | 117/197 |
| Part mondiale | 0,08 % | 0,02 % |
| PIB, dollars US constants de 2015 | 81,5 Md $US | 16,6 Md $US |
| Écart de PIB | 3,5× | 0,28× |
Comparer le PIB de 2 pays au choix
Sources :
- Banque mondiale | Économie et croissance (1960–2025, mis à jour en octobre 2026)
Creative Commons Attribution (CC BY) : vous pouvez copier, partager, adapter et réutiliser ce contenu, y compris à des fins commerciales, à condition de citer statistics.wiki et d’indiquer les modifications apportées. Les sources citées ci-dessus peuvent avoir leurs propres conditions de licence.