
Sierra Leone vs Guinée : PIB, 1960–2025
| Année | PIB, dollars US courants | |
|---|---|---|
 Sierra Leone |
 Guinée |
|
| 2025 | 7 464 157 904 $ US | 28 346 024 753 $ US |
| 2024 | 6 971 127 234 $ US | 25 008 678 293 $ US |
| 2023 | 6 415 852 766 $ US | 22 407 615 556 $ US |
| 2022 | 7 121 125 277 $ US | 19 910 452 542 $ US |
| 2021 | 7 166 931 483 $ US | 17 069 115 738 $ US |
| 2020 | 6 688 307 706 $ US | 14 088 693 743 $ US |
| 2019 | 6 523 577 590 $ US | 13 442 861 496 $ US |
| 2018 | 6 390 514 689 $ US | 11 857 030 367 $ US |
| 2017 | 5 749 846 528 $ US | 10 324 668 271 $ US |
| 2016 | 6 084 297 211 $ US | 8 595 955 222 $ US |
| 2015 | 6 788 352 975 $ US | 8 794 201 743 $ US |
| 2014 | 7 686 138 791 $ US | 8 778 473 373 $ US |
| 2013 | 7 502 762 863 $ US | 8 376 613 539 $ US |
| 2012 | 6 141 666 509 $ US | 7 638 044 557 $ US |
| 2011 | 4 861 632 885 $ US | 6 785 137 203 $ US |
| 2010 | 4 262 805 967 $ US | 6 853 467 146 $ US |
| 2009 | 3 953 403 098 $ US | 6 716 905 340 $ US |
| 2008 | 4 157 895 298 $ US | 6 964 179 983 $ US |
| 2007 | 3 632 957 611 $ US | 6 281 918 226 $ US |
| 2006 | 3 263 697 467 $ US | 4 220 019 845 $ US |
| 2005 | 2 545 275 313 $ US | 4 282 468 637 $ US |
| 2004 | 2 237 350 687 $ US | 5 300 767 961 $ US |
| 2003 | 2 142 618 046 $ US | 5 025 167 975 $ US |
| 2002 | 1 933 863 911 $ US | 4 301 608 753 $ US |
| 2001 | 1 681 473 894 $ US | 4 125 527 603 $ US |
| 2000 | 635 866 404 $ US | 4 367 458 867 $ US |
| 1999 | 669 386 624 $ US | 5 046 806 783 $ US |
| 1998 | 672 368 187 $ US | 5 232 118 046 $ US |
| 1997 | 850 232 760 $ US | 5 516 916 163 $ US |
| 1996 | 941 709 423 $ US | 5 641 243 100 $ US |
| 1995 | 870 740 292 $ US | 5 385 704 166 $ US |
| 1994 | 911 853 802 $ US | 4 932 800 407 $ US |
| 1993 | 768 867 883 $ US | 4 781 166 117 $ US |
| 1992 | 679 940 814 $ US | 4 789 220 417 $ US |
| 1991 | 779 981 987 $ US | 4 396 178 694 $ US |
| 1990 | 649 644 098 $ US | 3 888 320 666 $ US |
| 1989 | 932 974 420 $ US | 3 546 079 263 $ US |
| 1988 | 1 055 083 933 $ US | 3 476 480 303 $ US |
| 1987 | 660 106 336 $ US | 2 976 714 019 $ US |
| 1986 | 490 181 457 $ US | 2 909 130 355 $ US |
| 1985 | 856 890 459 $ US | 22 787 644 566 $ US |
| 1984 | 1 087 471 862 $ US | 18 421 497 251 $ US |
| 1983 | 995 104 305 $ US | 15 129 893 722 $ US |
| 1982 | 1 295 361 886 $ US | 11 926 032 493 $ US |
| 1981 | 1 114 830 472 $ US | 9 646 440 667 $ US |
| 1980 | 1 100 685 845 $ US | 9 746 524 915 $ US |
| 1979 | 1 109 374 911 $ US | 8 877 094 497 $ US |
| 1978 | 960 728 339 $ US | 8 087 305 999 $ US |
| 1977 | 691 777 584 $ US | 6 914 381 291 $ US |
| 1976 | 594 895 942 $ US | 6 762 781 871 $ US |
| 1975 | 679 336 344 $ US | 6 102 769 605 $ US |
| 1974 | 648 590 643 $ US | 5 691 417 541 $ US |
| 1973 | 575 230 724 $ US | 5 152 080 388 $ US |
| 1972 | 465 381 340 $ US | 4 203 069 035 $ US |
| 1971 | 419 549 305 $ US | 3 594 302 908 $ US |
| 1970 | 434 410 974 $ US | 3 220 224 608 $ US |
| 1969 | 408 690 163 $ US | - |
| 1968 | 329 859 732 $ US | - |
| 1967 | 348 795 303 $ US | - |
| 1966 | 375 479 850 $ US | - |
| 1965 | 359 379 856 $ US | - |
| 1964 | 371 847 461 $ US | - |
| 1963 | 348 547 279 $ US | - |
| 1962 | 342 721 416 $ US | - |
| 1961 | 327 834 191 $ US | - |
| 1960 | 322 009 962 $ US | - |
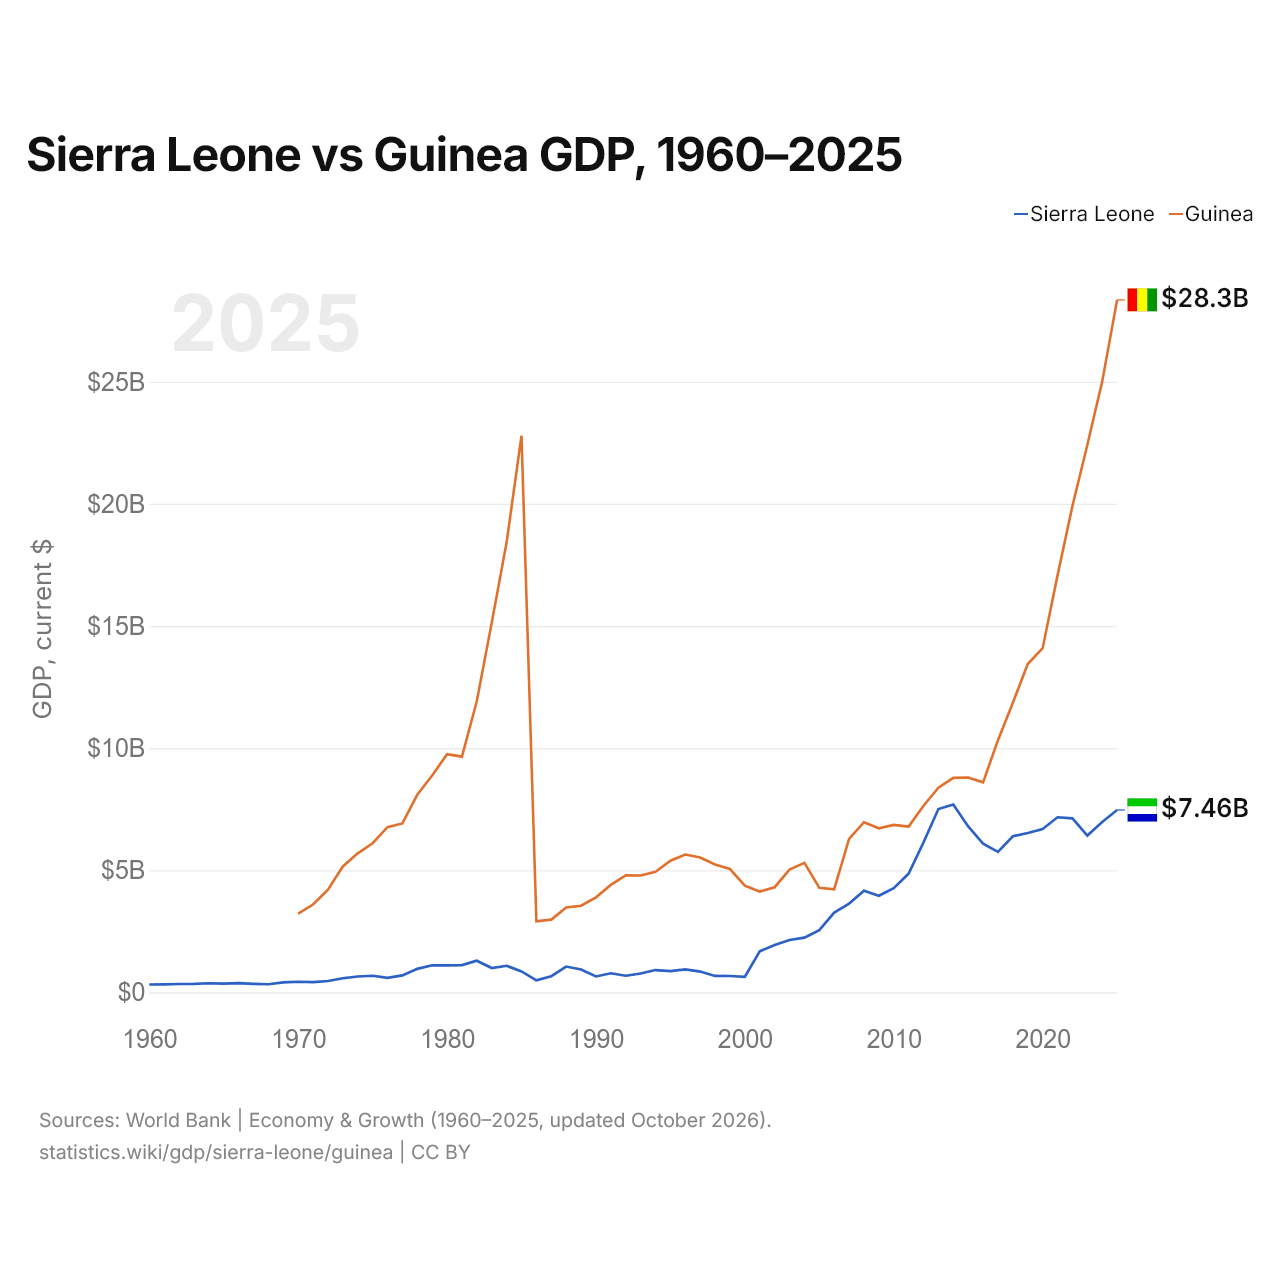
En 2025, le PIB de la Guinée (28,3 milliards de dollars US) était 3,8 fois celui de la Sierra Leone (7,46 milliards de dollars US). En 2015, l'écart était de 30 %. De 2015 à 2025, à prix constants de 2015, le PIB de la Guinée a progressé de 88,6 % et celui de la Sierra Leone de 51,5 %.
Depuis 1970, le PIB de la Guinée a chaque année été le plus élevé des deux ; en 1970, il était 7,4 fois celui de la Sierra Leone. En 2025, le PIB par habitant était de 846 $ US en Sierra Leone et de 1 877 $ US en Guinée, soit 2,2 fois plus élevé en Guinée.
Sierra Leone vs Guinée : derniers chiffres du PIB
|
Sierra Leone
|
Guinée
|
|
|---|---|---|
| PIB, dollars US courants | 7,46 Md $US | 28,3 Md $US |
| Rang mondial | 160/197 | 117/197 |
| Part mondiale | 0,006 % | 0,02 % |
| PIB, dollars US constants de 2015 | 10,3 Md $US | 16,6 Md $US |
| Écart de PIB | 0,26× | 3,8× |
Comparer le PIB de 2 pays au choix
Sources :
- Banque mondiale | Économie et croissance (1960–2025, mis à jour en octobre 2026)
Creative Commons Attribution (CC BY) : vous pouvez copier, partager, adapter et réutiliser ce contenu, y compris à des fins commerciales, à condition de citer statistics.wiki et d’indiquer les modifications apportées. Les sources citées ci-dessus peuvent avoir leurs propres conditions de licence.