
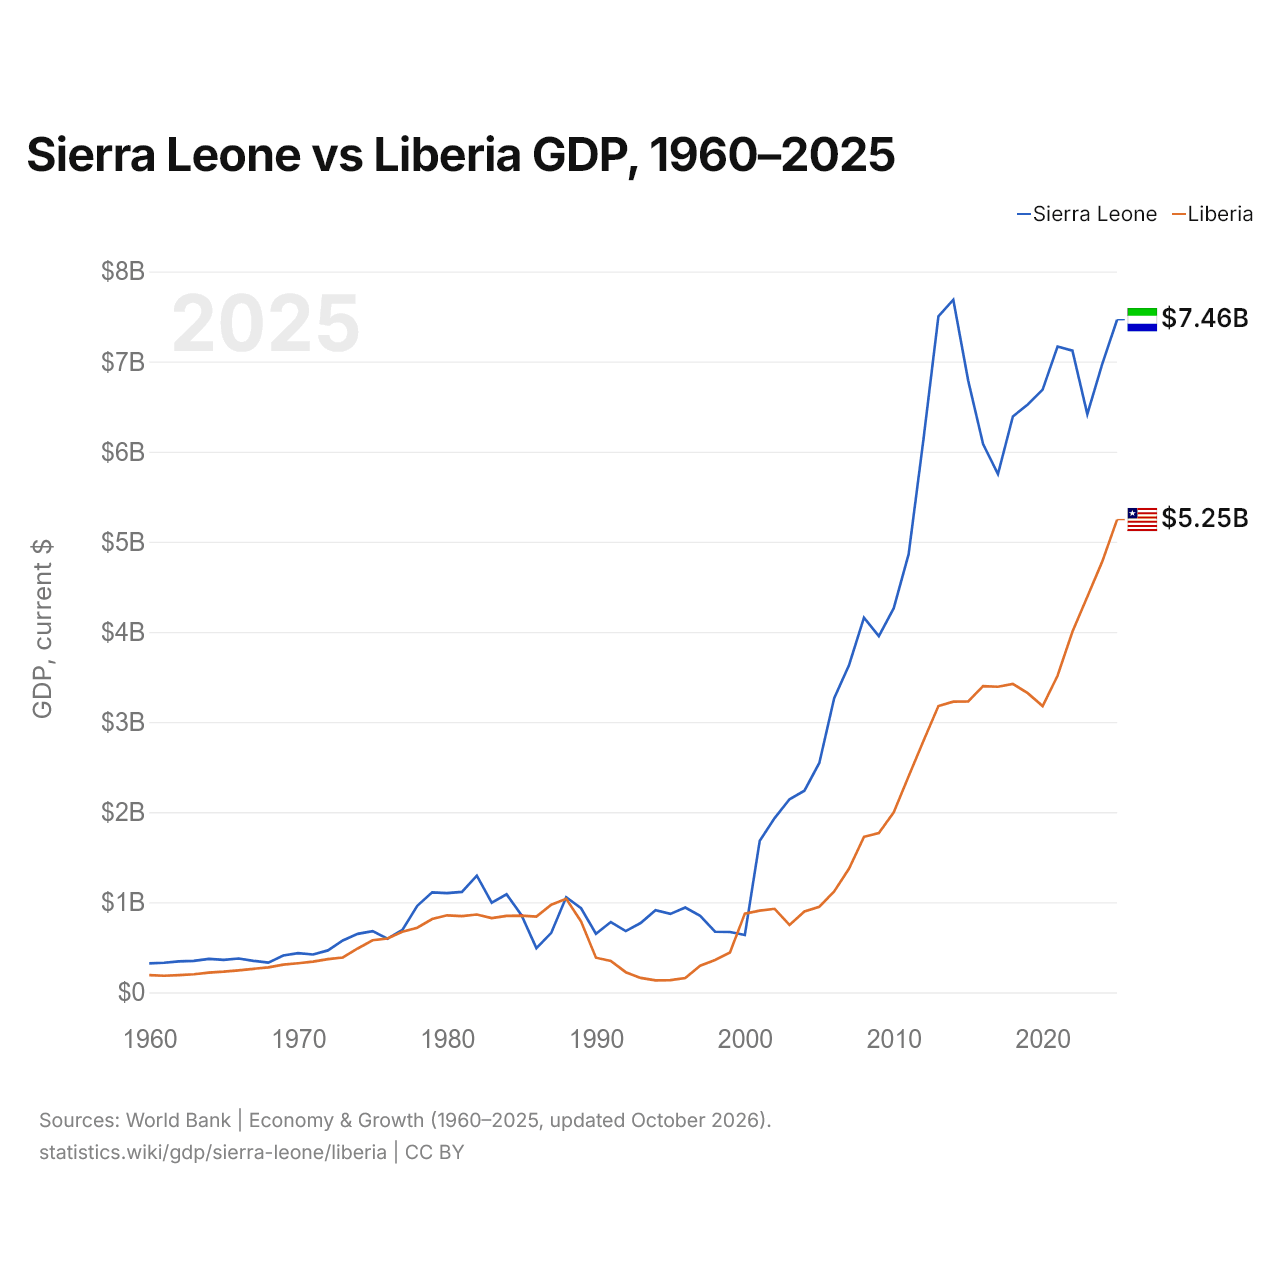
Sierra Leone vs Liberia : PIB, 1960–2025
| Année | PIB, dollars US courants | |
|---|---|---|
 Sierra Leone |
 Liberia |
|
| 2025 | 7 464 157 904 $ US | 5 245 938 900 $ US |
| 2024 | 6 971 127 234 $ US | 4 779 300 900 $ US |
| 2023 | 6 415 852 766 $ US | 4 390 000 000 $ US |
| 2022 | 7 121 125 277 $ US | 4 001 047 000 $ US |
| 2021 | 7 166 931 483 $ US | 3 513 049 500 $ US |
| 2020 | 6 688 307 706 $ US | 3 176 126 300 $ US |
| 2019 | 6 523 577 590 $ US | 3 319 596 500 $ US |
| 2018 | 6 390 514 689 $ US | 3 422 754 800 $ US |
| 2017 | 5 749 846 528 $ US | 3 390 703 400 $ US |
| 2016 | 6 084 297 211 $ US | 3 398 419 600 $ US |
| 2015 | 6 788 352 975 $ US | 3 227 075 700 $ US |
| 2014 | 7 686 138 791 $ US | 3 225 652 000 $ US |
| 2013 | 7 502 762 863 $ US | 3 177 198 100 $ US |
| 2012 | 6 141 666 509 $ US | 2 791 614 000 $ US |
| 2011 | 4 861 632 885 $ US | 2 398 000 000 $ US |
| 2010 | 4 262 805 967 $ US | 1 998 000 000 $ US |
| 2009 | 3 953 403 098 $ US | 1 768 000 000 $ US |
| 2008 | 4 157 895 298 $ US | 1 726 000 000 $ US |
| 2007 | 3 632 957 611 $ US | 1 373 000 000 $ US |
| 2006 | 3 263 697 467 $ US | 1 119 000 000 $ US |
| 2005 | 2 545 275 313 $ US | 949 000 000 $ US |
| 2004 | 2 237 350 687 $ US | 897 000 000 $ US |
| 2003 | 2 142 618 046 $ US | 748 000 000 $ US |
| 2002 | 1 933 863 911 $ US | 927 000 000 $ US |
| 2001 | 1 681 473 894 $ US | 906 000 000 $ US |
| 2000 | 635 866 404 $ US | 874 000 000 $ US |
| 1999 | 669 386 624 $ US | 441 800 000 $ US |
| 1998 | 672 368 187 $ US | 359 600 000 $ US |
| 1997 | 850 232 760 $ US | 295 900 000 $ US |
| 1996 | 941 709 423 $ US | 159 400 000 $ US |
| 1995 | 870 740 292 $ US | 134 800 000 $ US |
| 1994 | 911 853 802 $ US | 132 200 000 $ US |
| 1993 | 768 867 883 $ US | 160 400 000 $ US |
| 1992 | 679 940 814 $ US | 223 500 000 $ US |
| 1991 | 779 981 987 $ US | 348 000 000 $ US |
| 1990 | 649 644 098 $ US | 384 400 000 $ US |
| 1989 | 932 974 420 $ US | 786 300 000 $ US |
| 1988 | 1 055 083 933 $ US | 1 038 300 000 $ US |
| 1987 | 660 106 336 $ US | 972 800 000 $ US |
| 1986 | 490 181 457 $ US | 840 964 400 $ US |
| 1985 | 856 890 459 $ US | 851 296 100 $ US |
| 1984 | 1 087 471 862 $ US | 848 478 300 $ US |
| 1983 | 995 104 305 $ US | 823 374 900 $ US |
| 1982 | 1 295 361 886 $ US | 863 933 200 $ US |
| 1981 | 1 114 830 472 $ US | 846 514 500 $ US |
| 1980 | 1 100 685 845 $ US | 854 711 500 $ US |
| 1979 | 1 109 374 911 $ US | 814 067 900 $ US |
| 1978 | 960 728 339 $ US | 717 240 400 $ US |
| 1977 | 691 777 584 $ US | 673 010 600 $ US |
| 1976 | 594 895 942 $ US | 596 675 700 $ US |
| 1975 | 679 336 344 $ US | 577 549 300 $ US |
| 1974 | 648 590 643 $ US | 486 955 000 $ US |
| 1973 | 575 230 724 $ US | 386 968 300 $ US |
| 1972 | 465 381 340 $ US | 368 098 000 $ US |
| 1971 | 419 549 305 $ US | 341 543 100 $ US |
| 1970 | 434 410 974 $ US | 323 099 700 $ US |
| 1969 | 408 690 163 $ US | 306 961 800 $ US |
| 1968 | 329 859 732 $ US | 276 820 700 $ US |
| 1967 | 348 795 303 $ US | 261 024 300 $ US |
| 1966 | 375 479 850 $ US | 244 459 500 $ US |
| 1965 | 359 379 856 $ US | 229 260 800 $ US |
| 1964 | 371 847 461 $ US | 218 929 100 $ US |
| 1963 | 348 547 279 $ US | 200 229 600 $ US |
| 1962 | 342 721 416 $ US | 191 861 800 $ US |
| 1961 | 327 834 191 $ US | 183 920 900 $ US |
| 1960 | 322 009 962 $ US | 190 495 600 $ US |
En 2025, le PIB de la Sierra Leone (7,46 milliards de dollars US) était supérieur de 42 % à celui du Liberia (5,25 milliards de dollars US). En 2015, le rapport était de 2,1. De 2015 à 2025, à prix constants de 2015, le PIB de la Sierra Leone a progressé de 51,5 % et celui du Liberia de 21,5 %.
Depuis 2001, le PIB de la Sierra Leone est le plus élevé des deux ; il l'était aussi en 1960, 1,7 fois celui du Liberia. En 2025, le PIB par habitant était de 846 $ US en Sierra Leone et de 915 $ US au Liberia, soit 8,2 % de plus au Liberia.
Sierra Leone vs Liberia : derniers chiffres du PIB
|
Sierra Leone
|
Liberia
|
|
|---|---|---|
| PIB, dollars US courants | 7,46 Md $US | 5,25 Md $US |
| Rang mondial | 160/197 | 162/197 |
| Part mondiale | 0,006 % | 0,004 % |
| PIB, dollars US constants de 2015 | 10,3 Md $US | 3,92 Md $US |
| Écart de PIB | 1,4× | 0,7× |
Comparer le PIB de 2 pays au choix
Sources :
- Banque mondiale | Économie et croissance (1960–2025, mis à jour en octobre 2026)
Creative Commons Attribution (CC BY) : vous pouvez copier, partager, adapter et réutiliser ce contenu, y compris à des fins commerciales, à condition de citer statistics.wiki et d’indiquer les modifications apportées. Les sources citées ci-dessus peuvent avoir leurs propres conditions de licence.