
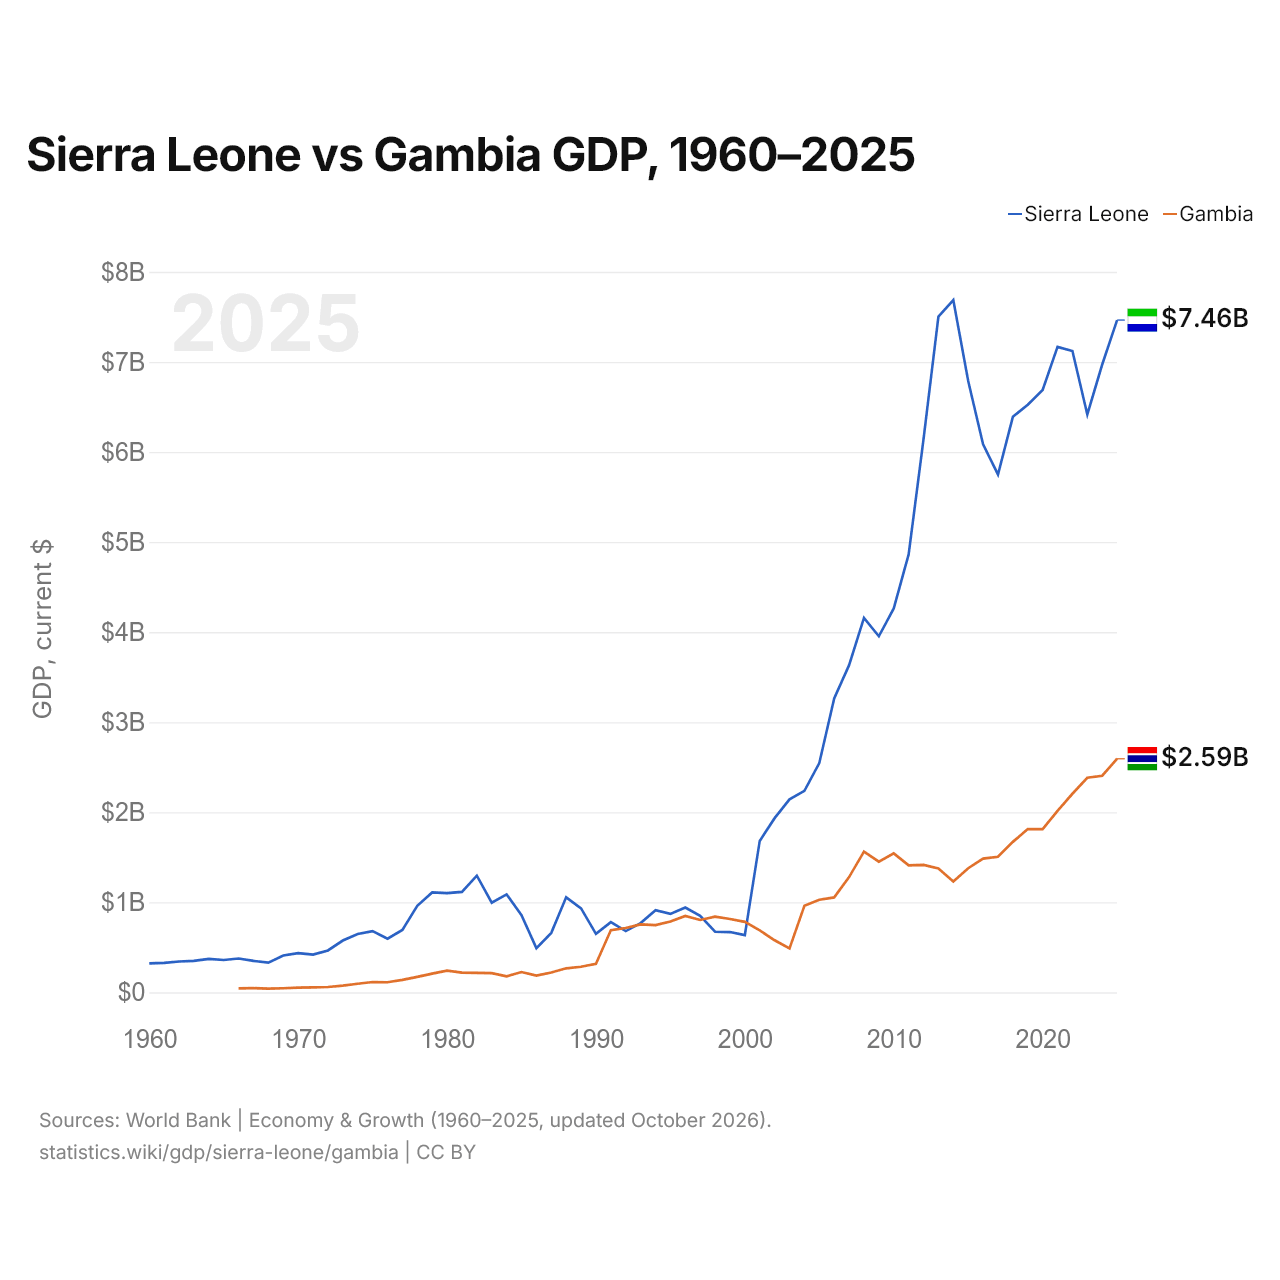
Sierra Leone vs Gambie : PIB, 1960–2025
| Année | PIB, dollars US courants | |
|---|---|---|
 Sierra Leone |
 Gambie |
|
| 2025 | 7 464 157 904 $ US | 2 593 673 988 $ US |
| 2024 | 6 971 127 234 $ US | 2 404 888 738 $ US |
| 2023 | 6 415 852 766 $ US | 2 382 262 185 $ US |
| 2022 | 7 121 125 277 $ US | 2 204 734 528 $ US |
| 2021 | 7 166 931 483 $ US | 2 014 158 842 $ US |
| 2020 | 6 688 307 706 $ US | 1 812 170 891 $ US |
| 2019 | 6 523 577 590 $ US | 1 813 609 692 $ US |
| 2018 | 6 390 514 689 $ US | 1 670 671 328 $ US |
| 2017 | 5 749 846 528 $ US | 1 504 909 463 $ US |
| 2016 | 6 084 297 211 $ US | 1 484 578 886 $ US |
| 2015 | 6 788 352 975 $ US | 1 378 176 609 $ US |
| 2014 | 7 686 138 791 $ US | 1 229 461 721 $ US |
| 2013 | 7 502 762 863 $ US | 1 375 609 453 $ US |
| 2012 | 6 141 666 509 $ US | 1 415 004 738 $ US |
| 2011 | 4 861 632 885 $ US | 1 409 693 597 $ US |
| 2010 | 4 262 805 967 $ US | 1 543 294 927 $ US |
| 2009 | 3 953 403 098 $ US | 1 450 142 509 $ US |
| 2008 | 4 157 895 298 $ US | 1 561 766 956 $ US |
| 2007 | 3 632 957 611 $ US | 1 279 703 047 $ US |
| 2006 | 3 263 697 467 $ US | 1 054 112 488 $ US |
| 2005 | 2 545 275 313 $ US | 1 027 701 068 $ US |
| 2004 | 2 237 350 687 $ US | 961 900 651 $ US |
| 2003 | 2 142 618 046 $ US | 487 038 685 $ US |
| 2002 | 1 933 863 911 $ US | 578 235 309 $ US |
| 2001 | 1 681 473 894 $ US | 687 410 645 $ US |
| 2000 | 635 866 404 $ US | 782 913 872 $ US |
| 1999 | 669 386 624 $ US | 814 724 032 $ US |
| 1998 | 672 368 187 $ US | 840 285 265 $ US |
| 1997 | 850 232 760 $ US | 803 633 342 $ US |
| 1996 | 941 709 423 $ US | 848 239 446 $ US |
| 1995 | 870 740 292 $ US | 785 999 865 $ US |
| 1994 | 911 853 802 $ US | 746 493 952 $ US |
| 1993 | 768 867 883 $ US | 755 040 974 $ US |
| 1992 | 679 940 814 $ US | 714 254 256 $ US |
| 1991 | 779 981 987 $ US | 690 311 081 $ US |
| 1990 | 649 644 098 $ US | 317 083 695 $ US |
| 1989 | 932 974 420 $ US | 284 120 329 $ US |
| 1988 | 1 055 083 933 $ US | 266 672 212 $ US |
| 1987 | 660 106 336 $ US | 220 626 484 $ US |
| 1986 | 490 181 457 $ US | 185 646 987 $ US |
| 1985 | 856 890 459 $ US | 225 726 359 $ US |
| 1984 | 1 087 471 862 $ US | 177 340 880 $ US |
| 1983 | 995 104 305 $ US | 213 448 585 $ US |
| 1982 | 1 295 361 886 $ US | 216 050 552 $ US |
| 1981 | 1 114 830 472 $ US | 218 767 743 $ US |
| 1980 | 1 100 685 845 $ US | 241 083 090 $ US |
| 1979 | 1 109 374 911 $ US | 207 112 628 $ US |
| 1978 | 960 728 339 $ US | 171 833 086 $ US |
| 1977 | 691 777 584 $ US | 138 093 099 $ US |
| 1976 | 594 895 942 $ US | 112 190 829 $ US |
| 1975 | 679 336 344 $ US | 115 179 719 $ US |
| 1974 | 648 590 643 $ US | 95 796 022 $ US |
| 1973 | 575 230 724 $ US | 75 187 749 $ US |
| 1972 | 465 381 340 $ US | 59 160 569 $ US |
| 1971 | 419 549 305 $ US | 55 728 663 $ US |
| 1970 | 434 410 974 $ US | 52 296 084 $ US |
| 1969 | 408 690 163 $ US | 45 168 072 $ US |
| 1968 | 329 859 732 $ US | 41 160 066 $ US |
| 1967 | 348 795 303 $ US | 46 695 007 $ US |
| 1966 | 375 479 850 $ US | 44 212 081 $ US |
| 1965 | 359 379 856 $ US | - |
| 1964 | 371 847 461 $ US | - |
| 1963 | 348 547 279 $ US | - |
| 1962 | 342 721 416 $ US | - |
| 1961 | 327 834 191 $ US | - |
| 1960 | 322 009 962 $ US | - |
En 2025, le PIB de la Sierra Leone (7,46 milliards de dollars US) était 2,9 fois celui de la Gambie (2,59 milliards de dollars US). En 2015, le rapport était de 4,9. De 2015 à 2025, à prix constants de 2015, le PIB de la Sierra Leone a progressé de 51,5 % et celui de la Gambie de 61,0 %.
Depuis 2001, le PIB de la Sierra Leone est le plus élevé des deux ; il l'était aussi en 1966, 8,5 fois celui de la Gambie. En 2025, le PIB par habitant était de 846 $ US en Sierra Leone et de 919 $ US en Gambie, soit 8,6 % de plus en Gambie.
Sierra Leone vs Gambie : derniers chiffres du PIB
|
Sierra Leone
|
Gambie
|
|
|---|---|---|
| PIB, dollars US courants | 7,46 Md $US | 2,59 Md $US |
| Rang mondial | 160/197 | 174/197 |
| Part mondiale | 0,006 % | 0,002 % |
| PIB, dollars US constants de 2015 | 10,3 Md $US | 2,22 Md $US |
| Écart de PIB | 2,9× | 0,35× |
Comparer le PIB de 2 pays au choix
Sources :
- Banque mondiale | Économie et croissance (1960–2025, mis à jour en octobre 2026)
Creative Commons Attribution (CC BY) : vous pouvez copier, partager, adapter et réutiliser ce contenu, y compris à des fins commerciales, à condition de citer statistics.wiki et d’indiquer les modifications apportées. Les sources citées ci-dessus peuvent avoir leurs propres conditions de licence.