
Guinée-Bissau vs Gambie : PIB, 1966–2025
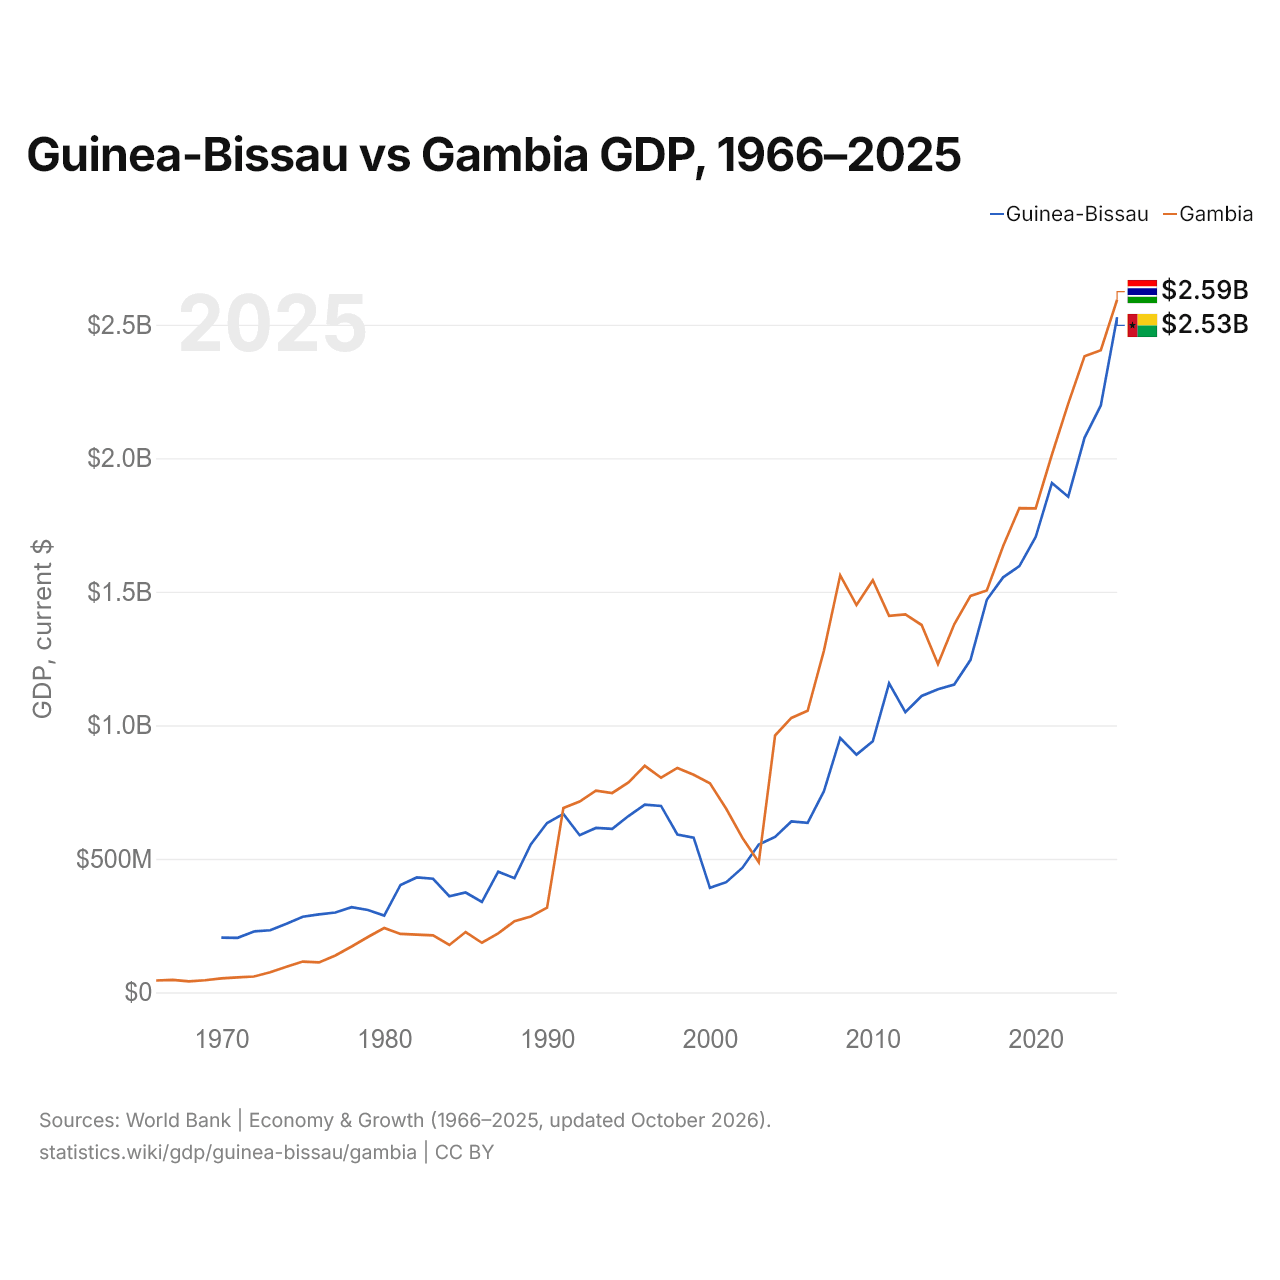
| Année | PIB, dollars US courants | |
|---|---|---|
 Guinée-Bissau |
 Gambie |
|
| 2025 | 2 527 930 273 $ US | 2 593 673 988 $ US |
| 2024 | 2 197 777 210 $ US | 2 404 888 738 $ US |
| 2023 | 2 076 748 678 $ US | 2 382 262 185 $ US |
| 2022 | 1 856 239 955 $ US | 2 204 734 528 $ US |
| 2021 | 1 907 611 288 $ US | 2 014 158 842 $ US |
| 2020 | 1 705 062 170 $ US | 1 812 170 891 $ US |
| 2019 | 1 596 214 680 $ US | 1 813 609 692 $ US |
| 2018 | 1 554 133 594 $ US | 1 670 671 328 $ US |
| 2017 | 1 469 978 606 $ US | 1 504 909 463 $ US |
| 2016 | 1 245 074 264 $ US | 1 484 578 886 $ US |
| 2015 | 1 152 384 167 $ US | 1 378 176 609 $ US |
| 2014 | 1 135 250 721 $ US | 1 229 461 721 $ US |
| 2013 | 1 109 682 824 $ US | 1 375 609 453 $ US |
| 2012 | 1 049 412 177 $ US | 1 415 004 738 $ US |
| 2011 | 1 157 074 319 $ US | 1 409 693 597 $ US |
| 2010 | 940 112 539 $ US | 1 543 294 927 $ US |
| 2009 | 890 167 833 $ US | 1 450 142 509 $ US |
| 2008 | 952 667 544 $ US | 1 561 766 956 $ US |
| 2007 | 753 162 998 $ US | 1 279 703 047 $ US |
| 2006 | 634 781 901 $ US | 1 054 112 488 $ US |
| 2005 | 639 776 041 $ US | 1 027 701 068 $ US |
| 2004 | 582 169 841 $ US | 961 900 651 $ US |
| 2003 | 553 614 800 $ US | 487 038 685 $ US |
| 2002 | 466 773 711 $ US | 578 235 309 $ US |
| 2001 | 412 610 872 $ US | 687 410 645 $ US |
| 2000 | 391 345 597 $ US | 782 913 872 $ US |
| 1999 | 579 365 780 $ US | 814 724 032 $ US |
| 1998 | 591 034 143 $ US | 840 285 265 $ US |
| 1997 | 698 107 222 $ US | 803 633 342 $ US |
| 1996 | 702 965 148 $ US | 848 239 446 $ US |
| 1995 | 660 195 402 $ US | 785 999 865 $ US |
| 1994 | 612 502 085 $ US | 746 493 952 $ US |
| 1993 | 615 779 519 $ US | 755 040 974 $ US |
| 1992 | 588 309 271 $ US | 714 254 256 $ US |
| 1991 | 668 470 891 $ US | 690 311 081 $ US |
| 1990 | 634 187 269 $ US | 317 083 695 $ US |
| 1989 | 554 072 303 $ US | 284 120 329 $ US |
| 1988 | 427 514 322 $ US | 266 672 212 $ US |
| 1987 | 451 893 375 $ US | 220 626 484 $ US |
| 1986 | 338 524 233 $ US | 185 646 987 $ US |
| 1985 | 373 959 151 $ US | 225 726 359 $ US |
| 1984 | 359 980 491 $ US | 177 340 880 $ US |
| 1983 | 425 225 177 $ US | 213 448 585 $ US |
| 1982 | 430 284 022 $ US | 216 050 552 $ US |
| 1981 | 402 230 865 $ US | 218 767 743 $ US |
| 1980 | 287 648 258 $ US | 241 083 090 $ US |
| 1979 | 308 143 183 $ US | 207 112 628 $ US |
| 1978 | 318 876 550 $ US | 171 833 086 $ US |
| 1977 | 298 871 675 $ US | 138 093 099 $ US |
| 1976 | 292 152 321 $ US | 112 190 829 $ US |
| 1975 | 283 311 997 $ US | 115 179 719 $ US |
| 1974 | 256 769 730 $ US | 95 796 022 $ US |
| 1973 | 232 331 281 $ US | 75 187 749 $ US |
| 1972 | 227 986 203 $ US | 59 160 569 $ US |
| 1971 | 204 167 297 $ US | 55 728 663 $ US |
| 1970 | 204 670 551 $ US | 52 296 084 $ US |
| 1969 | - | 45 168 072 $ US |
| 1968 | - | 41 160 066 $ US |
| 1967 | - | 46 695 007 $ US |
| 1966 | - | 44 212 081 $ US |
En 2025, le PIB de la Gambie (2,59 milliards de dollars US) était à peu près égal à celui de la Guinée-Bissau (2,53 milliards de dollars US). En 2015, l'écart était de 20 %. De 2015 à 2025, à prix constants de 2015, le PIB de la Gambie a progressé de 61,0 % et celui de la Guinée-Bissau de 58,9 %.
Depuis 2004, le PIB de la Gambie est le plus élevé des deux ; en 1970, celui de la Guinée-Bissau était 3,9 fois celui de la Gambie. En 2025, le PIB par habitant était de 1 124 $ US en Guinée-Bissau et de 919 $ US en Gambie, soit 22 % de plus en Guinée-Bissau.
Guinée-Bissau vs Gambie : derniers chiffres du PIB
|
Guinée-Bissau
|
Gambie
|
|
|---|---|---|
| PIB, dollars US courants | 2,53 Md $US | 2,59 Md $US |
| Rang mondial | 176/197 | 174/197 |
| Part mondiale | 0,002 % | 0,002 % |
| PIB, dollars US constants de 2015 | 1,83 Md $US | 2,22 Md $US |
| Écart de PIB | 0,97× | 1× |
Comparer le PIB de 2 pays au choix
Sources :
- Banque mondiale | Économie et croissance (1966–2025, mis à jour en octobre 2026)
Creative Commons Attribution (CC BY) : vous pouvez copier, partager, adapter et réutiliser ce contenu, y compris à des fins commerciales, à condition de citer statistics.wiki et d’indiquer les modifications apportées. Les sources citées ci-dessus peuvent avoir leurs propres conditions de licence.