
Guinée-Bissau vs Gambie : PIB par habitant, 1966–2025
| Année | PIB par habitant, dollars US courants | |
|---|---|---|
 Guinée-Bissau |
 Gambie |
|
| 2025 | 1 124 $ US | 919 $ US |
| 2024 | 998 $ US | 871 $ US |
| 2023 | 964 $ US | 883 $ US |
| 2022 | 882 $ US | 836 $ US |
| 2021 | 927 $ US | 782 $ US |
| 2020 | 847 $ US | 720 $ US |
| 2019 | 811 $ US | 738 $ US |
| 2018 | 809 $ US | 696 $ US |
| 2017 | 783 $ US | 643 $ US |
| 2016 | 680 $ US | 650 $ US |
| 2015 | 645 $ US | 620 $ US |
| 2014 | 652 $ US | 568 $ US |
| 2013 | 654 $ US | 654 $ US |
| 2012 | 635 $ US | 693 $ US |
| 2011 | 720 $ US | 711 $ US |
| 2010 | 600 $ US | 801 $ US |
| 2009 | 583 $ US | 775 $ US |
| 2008 | 640 $ US | 859 $ US |
| 2007 | 519 $ US | 725 $ US |
| 2006 | 449 $ US | 615 $ US |
| 2005 | 463 $ US | 616 $ US |
| 2004 | 431 $ US | 593 $ US |
| 2003 | 420 $ US | 309 $ US |
| 2002 | 362 $ US | 377 $ US |
| 2001 | 327 $ US | 460 $ US |
| 2000 | 317 $ US | 538 $ US |
| 1999 | 479 $ US | 575 $ US |
| 1998 | 498 $ US | 610 $ US |
| 1997 | 599 $ US | 600 $ US |
| 1996 | 615 $ US | 652 $ US |
| 1995 | 589 $ US | 622 $ US |
| 1994 | 561 $ US | 608 $ US |
| 1993 | 582 $ US | 635 $ US |
| 1992 | 574 $ US | 623 $ US |
| 1991 | 672 $ US | 628 $ US |
| 1990 | 651 $ US | 301 $ US |
| 1989 | 578 $ US | 280,9 $ US |
| 1988 | 454 $ US | 274,9 $ US |
| 1987 | 488 $ US | 237 $ US |
| 1986 | 371 $ US | 207,7 $ US |
| 1985 | 417 $ US | 262,8 $ US |
| 1984 | 407 $ US | 214,8 $ US |
| 1983 | 489 $ US | 268,6 $ US |
| 1982 | 503 $ US | 282,1 $ US |
| 1981 | 477 $ US | 296 $ US |
| 1980 | 347 $ US | 338 $ US |
| 1979 | 376 $ US | 300 $ US |
| 1978 | 403 $ US | 257,6 $ US |
| 1977 | 403 $ US | 213,8 $ US |
| 1976 | 421 $ US | 179,3 $ US |
| 1975 | 435 $ US | 189,8 $ US |
| 1974 | 419 $ US | 162,6 $ US |
| 1973 | 392 $ US | 131,4 $ US |
| 1972 | 389 $ US | 106,5 $ US |
| 1971 | 348 $ US | 103,3 $ US |
| 1970 | 350 $ US | 99,8 $ US |
| 1969 | - | 88,7 $ US |
| 1968 | - | 83,1 $ US |
| 1967 | - | 97 $ US |
| 1966 | - | 94,4 $ US |
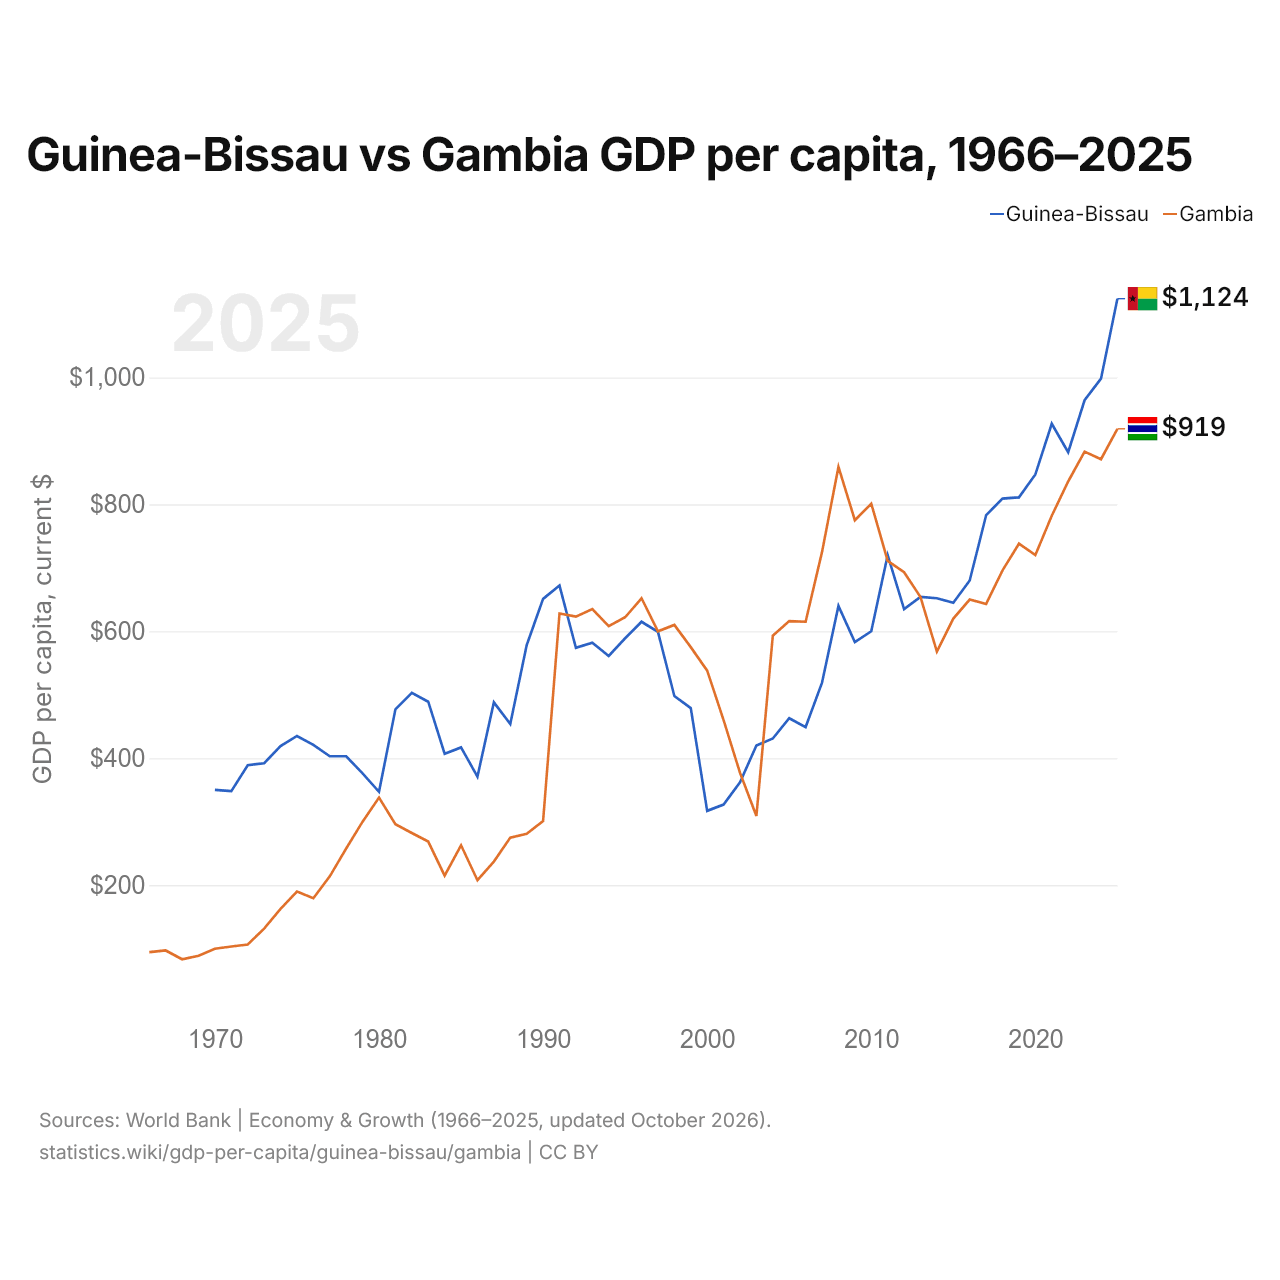
En 2025, le PIB par habitant était de 1 124 $ US en Guinée-Bissau et de 919 $ US en Gambie : 22 % de plus en Guinée-Bissau. En 1970, il était de 350 $ US en Guinée-Bissau et de 100 $ US en Gambie, soit 3,5 fois plus en Guinée-Bissau.
Le PIB par habitant de la Guinée-Bissau est plus élevé que celui de la Gambie chaque année depuis 2013. À prix constants de 2015, entre 1970 et 2025, le PIB par habitant de la Guinée-Bissau a progressé de 54 %, et celui de la Gambie a progressé de 36 %. En parité de pouvoir d'achat, l'ordre s'inverse : le PIB par habitant (PPA) est de 3 706 dollars en Gambie et de 3 293 dollars en Guinée-Bissau.
Guinée-Bissau vs Gambie : derniers chiffres du PIB par habitant
|
Guinée-Bissau
|
Gambie
|
|
|---|---|---|
| PIB par habitant, dollars US courants | 1 124 $US | 919 $US |
| Rang mondial | 177/197 | 183/197 |
| PIB par habitant, dollars US constants de 2015 | 814 $US | 786 $US |
| × moyenne mondiale | 0,08× | 0,06× |
| Écart de PIB par habitant | 1,2× | 0,82× |
Comparer le PIB par habitant de 2 pays au choix
Sources :
- Banque mondiale | Économie et croissance (1966–2025, mis à jour en octobre 2026)
Creative Commons Attribution (CC BY) : vous pouvez copier, partager, adapter et réutiliser ce contenu, y compris à des fins commerciales, à condition de citer statistics.wiki et d’indiquer les modifications apportées. Les sources citées ci-dessus peuvent avoir leurs propres conditions de licence.