
PIB par habitant de la France, 1960–2025
| Année | PIB par habitant | Rang mondial | |
|---|---|---|---|
| Dollars US courants | Dollars US constants de 2015 | ||
| 2025 | 48 986 $ US | 39 919 $ US | #27 |
| 2024 | 46 103 $ US | 39 683 $ US | #27 |
| 2023 | 44 700 $ US | 39 319 $ US | #27 |
| 2022 | 40 989 $ US | 38 868 $ US | #27 |
| 2021 | 43 725 $ US | 38 031 $ US | #26 |
| 2020 | 39 170 $ US | 35 709 $ US | #26 |
| 2019 | 40 408 $ US | 38 705 $ US | #28 |
| 2018 | 41 418 $ US | 38 062 $ US | #27 |
| 2017 | 38 687 $ US | 37 581 $ US | #28 |
| 2016 | 37 024 $ US | 36 921 $ US | #28 |
| 2015 | 36 702 $ US | 36 702 $ US | #26 |
| 2014 | 43 148 $ US | 36 444 $ US | #27 |
| 2013 | 42 669 $ US | 36 256 $ US | #27 |
| 2012 | 40 864 $ US | 36 161 $ US | #28 |
| 2011 | 43 930 $ US | 36 270 $ US | #27 |
| 2010 | 40 695 $ US | 35 578 $ US | #25 |
| 2009 | 41 728 $ US | 35 053 $ US | #20 |
| 2008 | 45 465 $ US | 36 257 $ US | #25 |
| 2007 | 41 486 $ US | 36 322 $ US | #24 |
| 2006 | 36 432 $ US | 35 645 $ US | #25 |
| 2005 | 34 696 $ US | 34 946 $ US | #24 |
| 2004 | 33 645 $ US | 34 557 $ US | #21 |
| 2003 | 29 480 $ US | 33 841 $ US | #22 |
| 2002 | 24 145 $ US | 33 754 $ US | #24 |
| 2001 | 22 332 $ US | 33 641 $ US | #24 |
| 2000 | 22 341 $ US | 33 255 $ US | #24 |
| 1999 | 24 576 $ US | 32 153 $ US | #20 |
| 1998 | 24 869 $ US | 31 257 $ US | #19 |
| 1997 | 24 169 $ US | 30 326 $ US | #21 |
| 1996 | 26 758 $ US | 29 684 $ US | #16 |
| 1995 | 26 792 $ US | 29 380 $ US | #16 |
| 1994 | 23 360 $ US | 28 823 $ US | #16 |
| 1993 | 22 239 $ US | 28 257 $ US | #17 |
| 1992 | 23 615 $ US | 28 483 $ US | #15 |
| 1991 | 21 501 $ US | 28 197 $ US | #19 |
| 1990 | 21 586 $ US | 27 993 $ US | #16 |
| 1989 | 17 547 $ US | 27 372 $ US | #17 |
| 1988 | 17 550 $ US | 26 374 $ US | #17 |
| 1987 | 16 176 $ US | 25 309 $ US | #18 |
| 1986 | 13 430 $ US | 24 813 $ US | #17 |
| 1985 | 9 657 $ US | 24 358 $ US | #20 |
| 1984 | 9 312 $ US | 24 102 $ US | #22 |
| 1983 | 9 862 $ US | 23 836 $ US | #22 |
| 1982 | 10 360 $ US | 23 667 $ US | #20 |
| 1981 | 10 956 $ US | 23 187 $ US | #18 |
| 1980 | 12 565 $ US | 23 051 $ US | #17 |
| 1979 | 11 063 $ US | 22 792 $ US | #19 |
| 1978 | 9 167 $ US | 22 079 $ US | #20 |
| 1977 | 7 459 $ US | 21 336 $ US | #22 |
| 1976 | 6 792 $ US | 20 701 $ US | #21 |
| 1975 | 6 617 $ US | 19 924 $ US | #20 |
| 1974 | 5 261 $ US | 20 210 $ US | #23 |
| 1973 | 4 907 $ US | 19 484 $ US | #16 |
| 1972 | 3 809 $ US | 18 497 $ US | #17 |
| 1971 | 3 137 $ US | 17 854 $ US | #16 |
| 1970 | 2 833 $ US | 17 117 $ US | #15 |
| 1969 | 2 729 $ US | 16 265 $ US | #11 |
| 1968 | 2 518 $ US | 15 313 $ US | #11 |
| 1967 | 2 328 $ US | 14 760 $ US | #12 |
| 1966 | 2 173 $ US | 14 199 $ US | #13 |
| 1965 | 2 024 $ US | 13 619 $ US | #13 |
| 1964 | 1 891 $ US | 13 116 $ US | #12 |
| 1963 | 1 723 $ US | 12 438 $ US | #13 |
| 1962 | 1 554 $ US | 11 841 $ US | #13 |
| 1961 | 1 402 $ US | 11 193 $ US | #14 |
| 1960 | 1 307 $ US | 10 776 $ US | #14 |
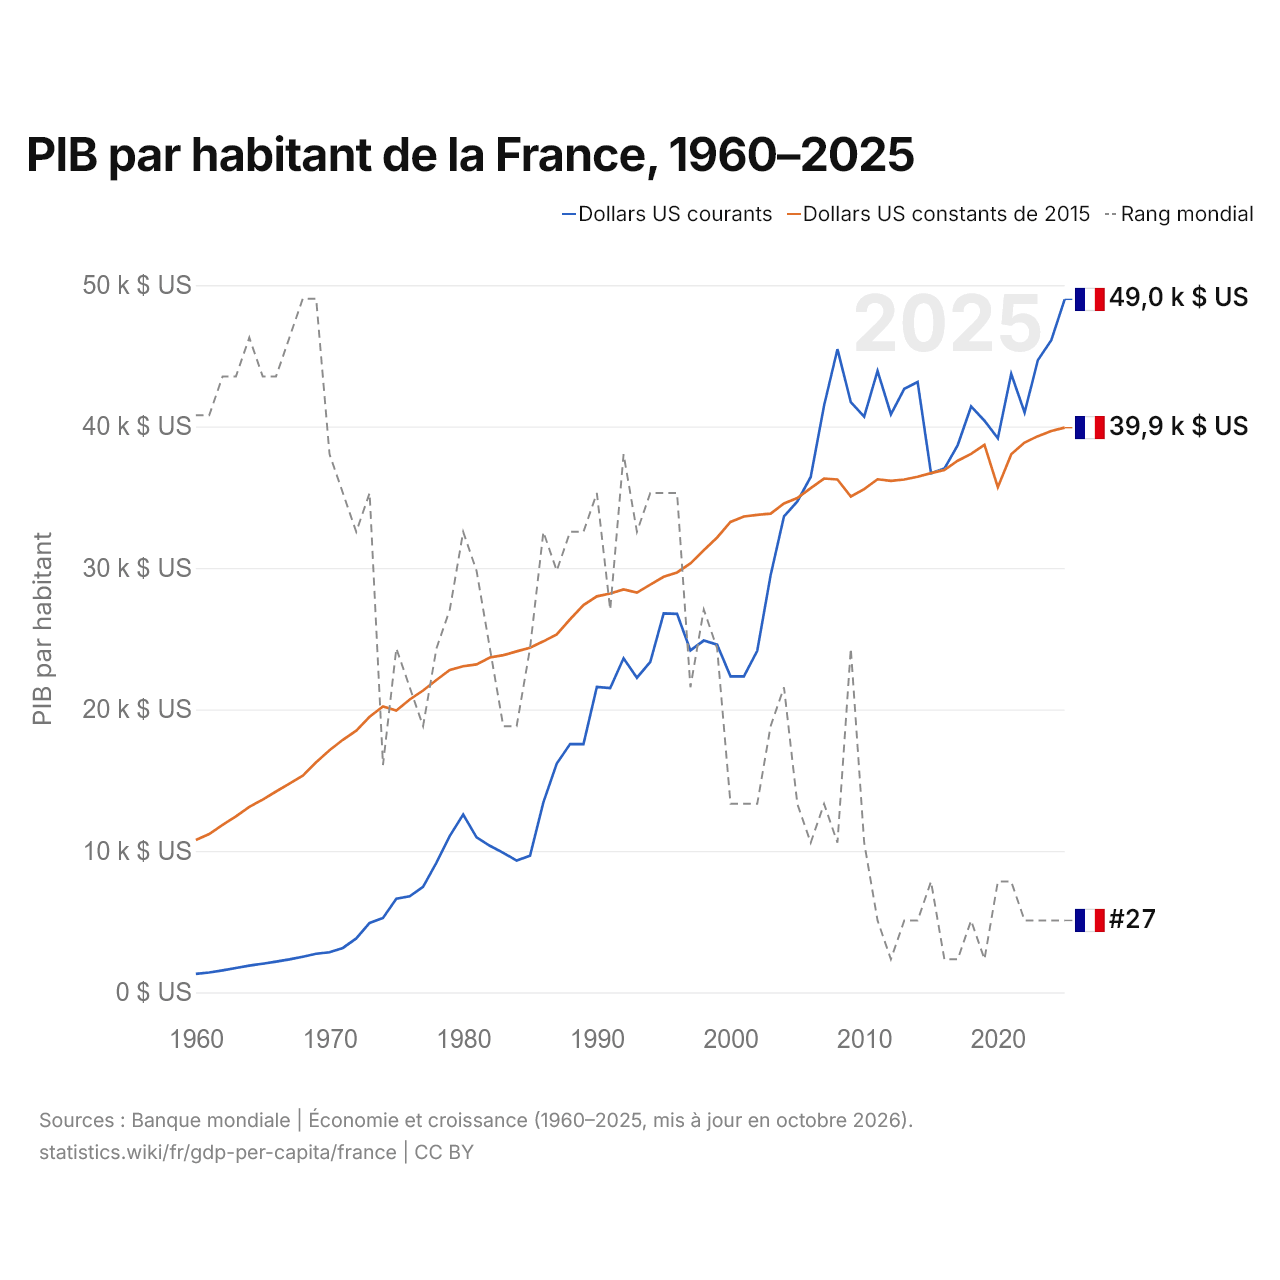
En 2025, le PIB par habitant de la France était de 48 986 $ US, contre 1 307 $ US en 1960. Celui de la France représentait 3,4 fois le PIB par habitant mondial, de 14 406 $ US. Il se classait au 27e rang mondial, un rang qu'il occupe depuis 2022. Son meilleur rang a été le 11e, occupé pour la dernière fois en 1969. À prix constants de 2015, le PIB par habitant a progressé de 0,6 % en 2025 et de 8,8 % sur les dix années écoulées depuis 2015.
À prix constants de 2015, le PIB par habitant de la France a été multiplié par 3,7 entre 1960 et 2025, soit une croissance moyenne de 2,0 % par an. Depuis 1960, par décennie, le PIB par habitant de la France a progressé le plus vite de 1960 à 1970, avec 4,7 % par an, et le plus lentement de 2010 à 2020, avec 0,0 % par an.
Le PIB par habitant de la France était le 18e plus élevé des 45 pays situés en Europe, où il allait de 5 496 $ US en Ukraine à 288 002 $ US à Monaco (2024). Le PIB par habitant (PPA) de la France était de 63 975 dollars en 2025, au 31e rang mondial.
La France dans le classement mondial du PIB par habitant, 2025
| Rang | Pays | PIB par habitant | × moyenne mondiale | |
|---|---|---|---|---|
| 24 |
 Andorre |
54 292 $US | 3,77× | vs Andorre |
| 25 |
 EAU |
50 274 $US (2024) | 3,67× | vs EAU |
| 26 |
 Nouvelle-Zélande |
49 591 $US | 3,44× | vs Nouvelle-Zélande |
| 27 |
 France |
48 986 $US | 3,4× | |
| 28 |
 Malte |
47 907 $US | 3,33× | vs Malte |
| 29 |
 Italie |
43 309 $US | 3,01× | vs Italie |
| 30 |
 Taïwan |
39 506 $US | 2,74× | vs Taïwan |
Comparer le PIB par habitant de la France avec celui d'autres pays
Sources :
- Banque mondiale | Économie et croissance (1960–2025, mis à jour en octobre 2026)
Creative Commons Attribution (CC BY) : vous pouvez copier, partager, adapter et réutiliser ce contenu, y compris à des fins commerciales, à condition de citer statistics.wiki et d’indiquer les modifications apportées. Les sources citées ci-dessus peuvent avoir leurs propres conditions de licence.