
PIB par habitant de Maurice, 1960–2025
| Année | PIB par habitant | Rang mondial | |
|---|---|---|---|
| Dollars US courants | Dollars US constants de 2015 | ||
| 2025 | 12 991 $ US | 12 315 $ US | #80 |
| 2024 | 11 991 $ US | 11 919 $ US | #77 |
| 2023 | 11 270 $ US | 11 331 $ US | #79 |
| 2022 | 10 247 $ US | 10 703 $ US | #77 |
| 2021 | 9 178 $ US | 9 849 $ US | #80 |
| 2020 | 9 136 $ US | 9 534 $ US | #70 |
| 2019 | 11 568 $ US | 11 111 $ US | #67 |
| 2018 | 11 819 $ US | 10 805 $ US | #64 |
| 2017 | 10 987 $ US | 10 384 $ US | #65 |
| 2016 | 10 095 $ US | 9 998 $ US | #66 |
| 2015 | 9 631 $ US | 9 631 $ US | #70 |
| 2014 | 10 490 $ US | 9 298 $ US | #71 |
| 2013 | 9 877 $ US | 8 969 $ US | #72 |
| 2012 | 9 422 $ US | 8 695 $ US | #74 |
| 2011 | 9 324 $ US | 8 423 $ US | #73 |
| 2010 | 8 113 $ US | 8 101 $ US | #76 |
| 2009 | 7 427 $ US | 7 778 $ US | #73 |
| 2008 | 8 140 $ US | 7 545 $ US | #73 |
| 2007 | 6 677 $ US | 7 180 $ US | #74 |
| 2006 | 5 784 $ US | 6 820 $ US | #75 |
| 2005 | 5 354 $ US | 6 534 $ US | #71 |
| 2004 | 5 461 $ US | 6 458 $ US | #66 |
| 2003 | 4 858 $ US | 6 229 $ US | #63 |
| 2002 | 4 073 $ US | 5 923 $ US | #68 |
| 2001 | 3 909 $ US | 5 870 $ US | #71 |
| 2000 | 3 982 $ US | 5 724 $ US | #69 |
| 1999 | 3 746 $ US | 5 343 $ US | #69 |
| 1998 | 3 642 $ US | 5 273 $ US | #70 |
| 1997 | 3 696 $ US | 5 024 $ US | #70 |
| 1996 | 3 952 $ US | 4 814 $ US | #65 |
| 1995 | 3 648 $ US | 4 606 $ US | #67 |
| 1994 | 3 240 $ US | 4 455 $ US | #64 |
| 1993 | 3 014 $ US | 4 338 $ US | #65 |
| 1992 | 3 013 $ US | 4 177 $ US | #65 |
| 1991 | 2 705 $ US | 3 974 $ US | #66 |
| 1990 | 2 540 $ US | 3 846 $ US | #70 |
| 1989 | 2 103 $ US | 3 614 $ US | #71 |
| 1988 | 2 074 $ US | 3 486 $ US | #71 |
| 1987 | 1 840 $ US | 3 287 $ US | #71 |
| 1986 | 1 442 $ US | 3 041 $ US | #78 |
| 1985 | 1 069 $ US | 2 793 $ US | #84 |
| 1984 | 1 042 $ US | 2 633 $ US | #90 |
| 1983 | 1 103 $ US | 2 541 $ US | #89 |
| 1982 | 1 101 $ US | 2 554 $ US | #87 |
| 1981 | 1 181 $ US | 2 451 $ US | #85 |
| 1980 | 1 187 $ US | 2 350 $ US | #82 |
| 1979 | 1 292 $ US | 2 657 $ US | #71 |
| 1978 | 1 102 $ US | 2 612 $ US | #73 |
| 1977 | 906 $ US | 2 548 $ US | #73 |
| 1976 | 787 $ US | 2 431 $ US | #72 |
| 1975 | 755 $ US | 1 996 $ US | #70 |
| 1974 | 763 $ US | 2 010 $ US | #69 |
| 1973 | 467 $ US | 1 875 $ US | #80 |
| 1972 | 374 $ US | 1 700 $ US | #83 |
| 1971 | 299,6 $ US | 1 593 $ US | #89 |
| 1970 | 271,3 $ US | 1 552 $ US | #90 |
| 1969 | 272,7 $ US | 1 584 $ US | #73 |
| 1968 | 258,7 $ US | 1 536 $ US | #73 |
| 1967 | 304 $ US | 1 681 $ US | #58 |
| 1966 | 296 $ US | 1 642 $ US | #58 |
| 1965 | 305 $ US | 1 738 $ US | #56 |
| 1964 | 297,3 $ US | 1 722 $ US | #54 |
| 1963 | 353 $ US | 1 895 $ US | #43 |
| 1962 | 282,3 $ US | 1 708 $ US | #53 |
| 1961 | 281,7 $ US | 1 743 $ US | #48 |
| 1960 | 238,3 $ US | 1 419 $ US | #57 |
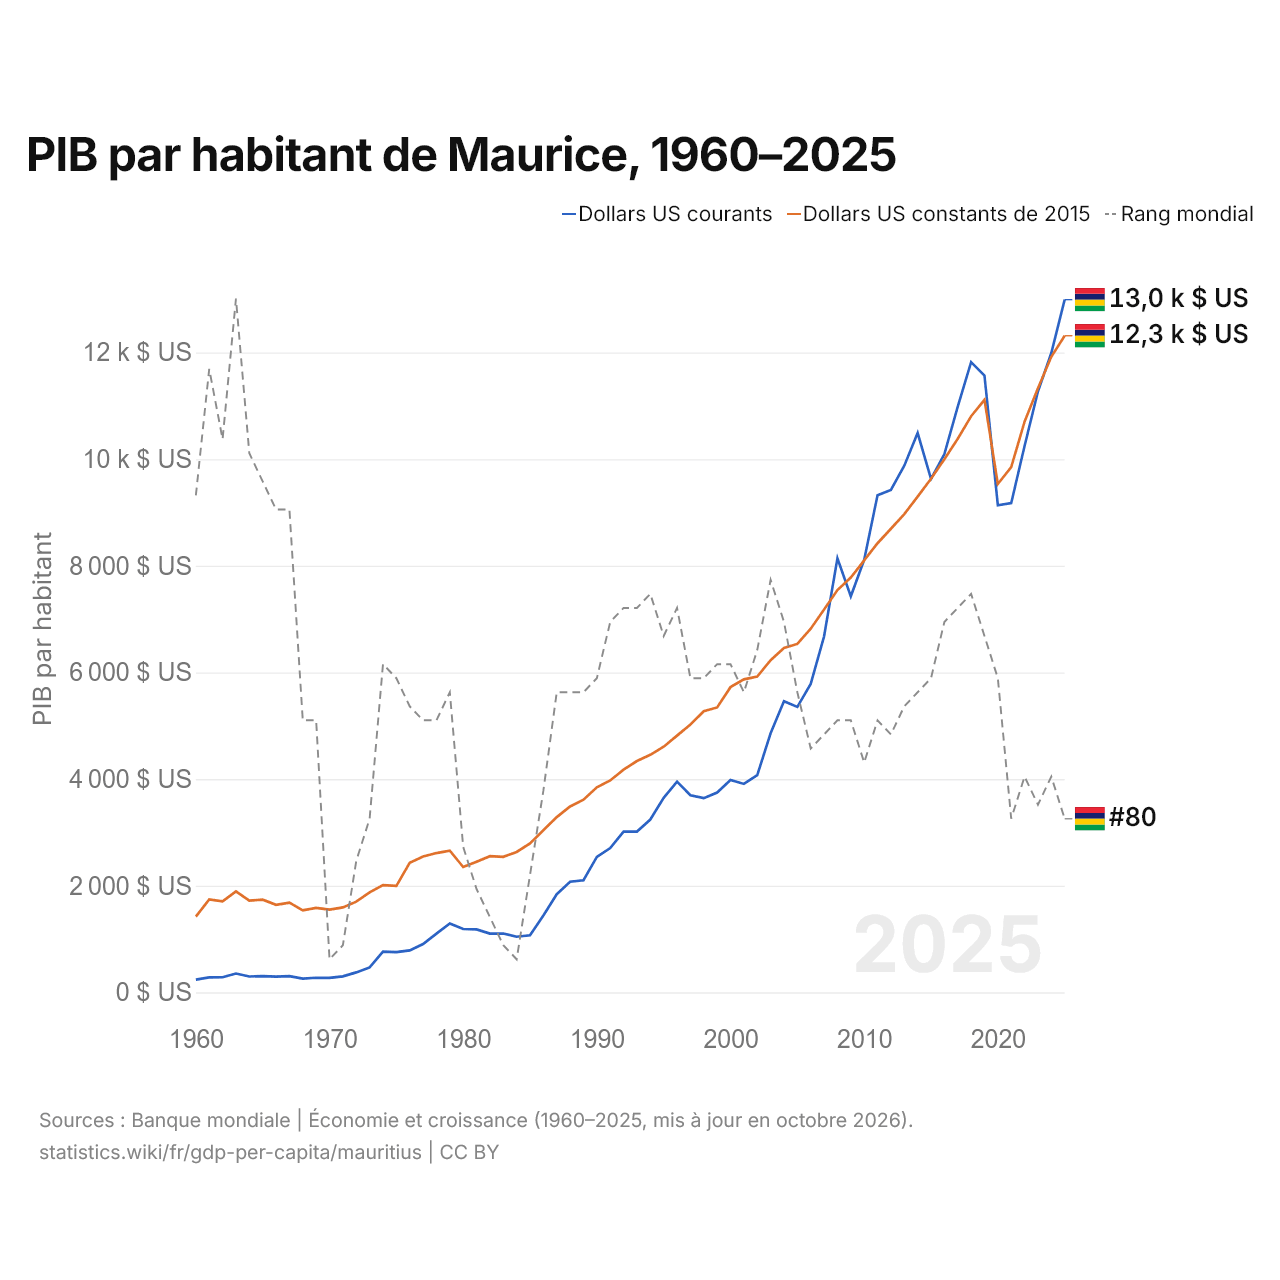
En 2025, le PIB par habitant de Maurice était de 12 991 $ US, contre 238 $ US en 1960. Celui de Maurice était proche du PIB par habitant mondial, de 14 406 $ US. Il se classait au 80e rang mondial, en baisse par rapport au 77e rang en 2024. Son meilleur rang a été le 43e, occupé pour la dernière fois en 1963. À prix constants de 2015, le PIB par habitant a progressé de 3,3 % en 2025 et de 27,9 % sur les dix années écoulées depuis 2015.
À prix constants de 2015, le PIB par habitant de Maurice a été multiplié par 8,7 entre 1960 et 2025, soit une croissance moyenne de 3,4 % par an. Depuis 1960, par décennie, le PIB par habitant de Maurice a progressé le plus vite de 1980 à 1990, avec 5,1 % par an, et le plus lentement de 1960 à 1970, avec 0,9 % par an.
Le PIB par habitant de Maurice était le 2e plus élevé des 54 pays situés en Afrique, où il allait de 234 $ US au Burundi à 19 449 $ US aux Seychelles. Le PIB par habitant (PPA) de Maurice était de 33 667 dollars en 2025, au 71e rang mondial.
Maurice dans le classement mondial du PIB par habitant, 2025
| Rang | Pays | PIB par habitant | × moyenne mondiale | |
|---|---|---|---|---|
| 77 |
 Chine |
13 862 $US | 0,96× | |
| 78 |
 Malaisie |
13 125 $US | 0,91× | |
| 79 |
 Albanie |
12 998 $US | 0,9× | |
| 80 |
 Maurice |
12 991 $US | 0,9× | |
| 81 |
 Saint-Vincent |
12 562 $US | 0,87× | |
| 82 |
 Grenade |
12 107 $US | 0,84× | |
| 83 |
 Rép. dominicaine |
11 059 $US | 0,77× |
Comparer le PIB par habitant de Maurice avec celui d'autres pays
Sources :
- Banque mondiale | Économie et croissance (1960–2025, mis à jour en octobre 2026)
Creative Commons Attribution (CC BY) : vous pouvez copier, partager, adapter et réutiliser ce contenu, y compris à des fins commerciales, à condition de citer statistics.wiki et d’indiquer les modifications apportées. Les sources citées ci-dessus peuvent avoir leurs propres conditions de licence.