
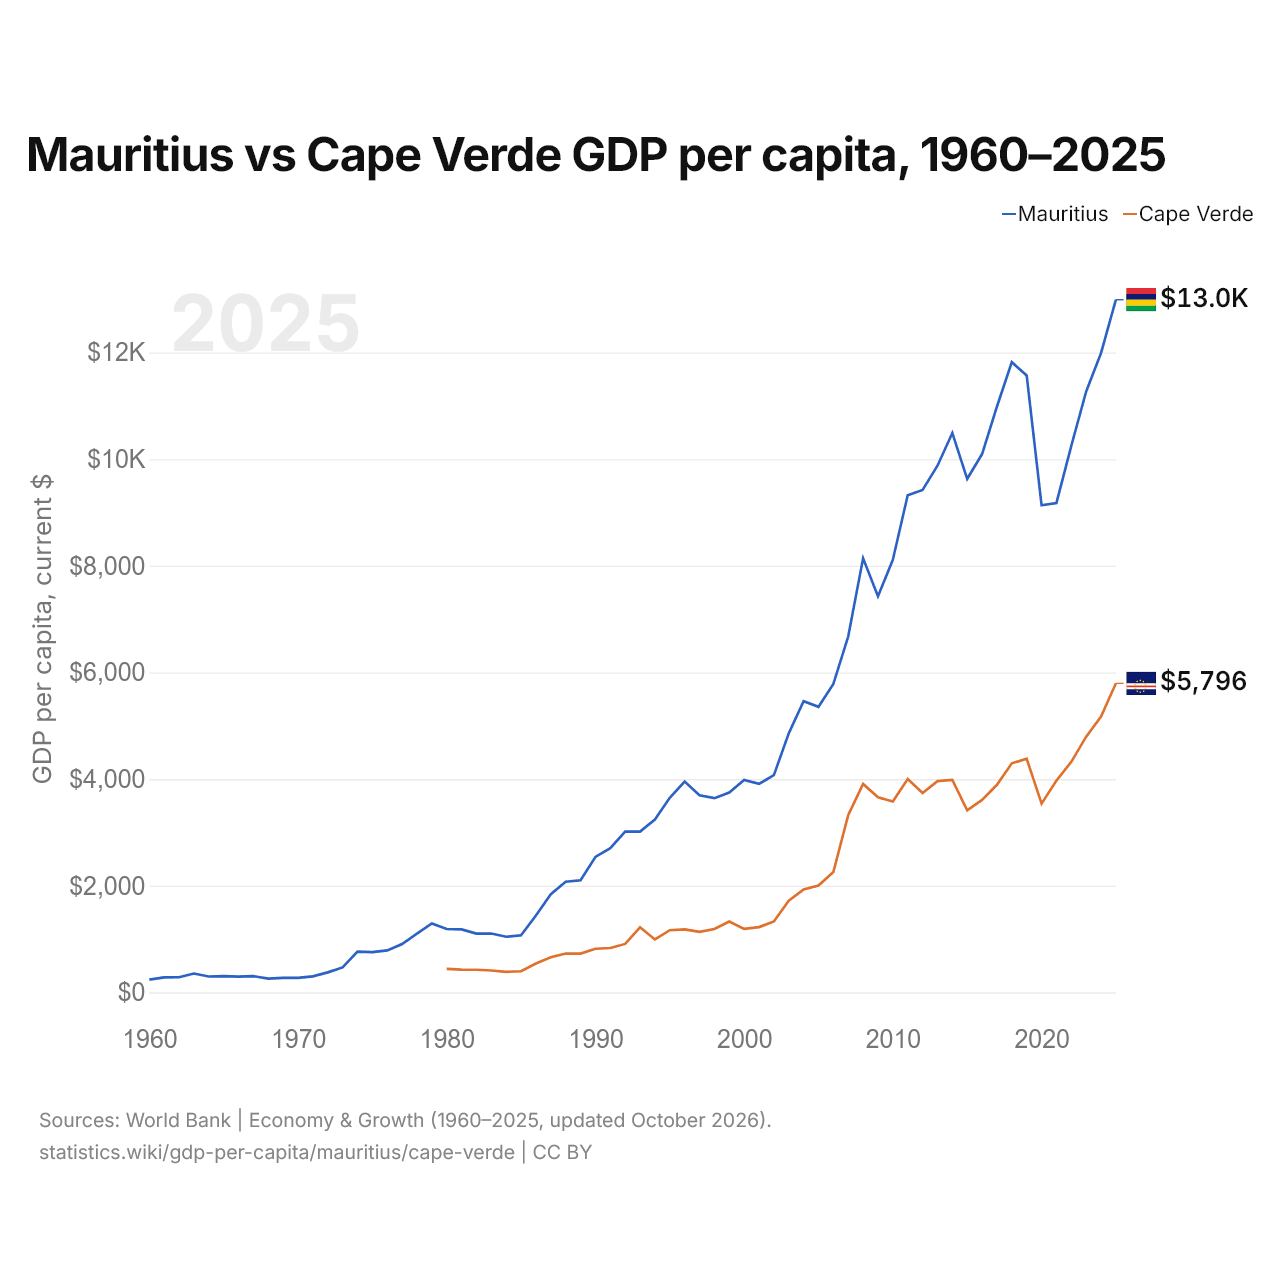
Maurice vs Cap-Vert : PIB par habitant, 1960–2025
| Année | PIB par habitant, dollars US courants | |
|---|---|---|
 Maurice |
 Cap-Vert |
|
| 2025 | 12 991 $ US | 5 796 $ US |
| 2024 | 11 991 $ US | 5 170 $ US |
| 2023 | 11 270 $ US | 4 795 $ US |
| 2022 | 10 247 $ US | 4 323 $ US |
| 2021 | 9 178 $ US | 3 971 $ US |
| 2020 | 9 136 $ US | 3 539 $ US |
| 2019 | 11 568 $ US | 4 381 $ US |
| 2018 | 11 819 $ US | 4 295 $ US |
| 2017 | 10 987 $ US | 3 893 $ US |
| 2016 | 10 095 $ US | 3 609 $ US |
| 2015 | 9 631 $ US | 3 415 $ US |
| 2014 | 10 490 $ US | 3 986 $ US |
| 2013 | 9 877 $ US | 3 961 $ US |
| 2012 | 9 422 $ US | 3 737 $ US |
| 2011 | 9 324 $ US | 4 002 $ US |
| 2010 | 8 113 $ US | 3 579 $ US |
| 2009 | 7 427 $ US | 3 660 $ US |
| 2008 | 8 140 $ US | 3 909 $ US |
| 2007 | 6 677 $ US | 3 325 $ US |
| 2006 | 5 784 $ US | 2 257 $ US |
| 2005 | 5 354 $ US | 2 004 $ US |
| 2004 | 5 461 $ US | 1 929 $ US |
| 2003 | 4 858 $ US | 1 718 $ US |
| 2002 | 4 073 $ US | 1 329 $ US |
| 2001 | 3 909 $ US | 1 223 $ US |
| 2000 | 3 982 $ US | 1 190 $ US |
| 1999 | 3 746 $ US | 1 327 $ US |
| 1998 | 3 642 $ US | 1 187 $ US |
| 1997 | 3 696 $ US | 1 134 $ US |
| 1996 | 3 952 $ US | 1 180 $ US |
| 1995 | 3 648 $ US | 1 165 $ US |
| 1994 | 3 240 $ US | 991 $ US |
| 1993 | 3 014 $ US | 1 220 $ US |
| 1992 | 3 013 $ US | 908 $ US |
| 1991 | 2 705 $ US | 832 $ US |
| 1990 | 2 540 $ US | 817 $ US |
| 1989 | 2 103 $ US | 727 $ US |
| 1988 | 2 074 $ US | 729 $ US |
| 1987 | 1 840 $ US | 658 $ US |
| 1986 | 1 442 $ US | 541 $ US |
| 1985 | 1 069 $ US | 396 $ US |
| 1984 | 1 042 $ US | 385 $ US |
| 1983 | 1 103 $ US | 410 $ US |
| 1982 | 1 101 $ US | 423 $ US |
| 1981 | 1 181 $ US | 425 $ US |
| 1980 | 1 187 $ US | 440 $ US |
| 1979 | 1 292 $ US | - |
| 1978 | 1 102 $ US | - |
| 1977 | 906 $ US | - |
| 1976 | 787 $ US | - |
| 1975 | 755 $ US | - |
| 1974 | 763 $ US | - |
| 1973 | 467 $ US | - |
| 1972 | 374 $ US | - |
| 1971 | 299,6 $ US | - |
| 1970 | 271,3 $ US | - |
| 1969 | 272,7 $ US | - |
| 1968 | 258,7 $ US | - |
| 1967 | 304 $ US | - |
| 1966 | 296 $ US | - |
| 1965 | 305 $ US | - |
| 1964 | 297,3 $ US | - |
| 1963 | 353 $ US | - |
| 1962 | 282,3 $ US | - |
| 1961 | 281,7 $ US | - |
| 1960 | 238,3 $ US | - |
En 2025, le PIB par habitant était de 12 991 $ US à Maurice et de 5 796 $ US au Cap-Vert : 2,2 fois plus élevé à Maurice. En 1980, il était de 1 187 $ US à Maurice et de 440 $ US au Cap-Vert, soit 2,7 fois plus à Maurice.
Le PIB par habitant de Maurice est plus élevé que celui du Cap-Vert chaque année depuis 1980. À prix constants de 2015, le PIB par habitant de Maurice a été multiplié par 5,2 entre 1980 et 2025, et celui du Cap-Vert par 8,1.
Maurice vs Cap-Vert : derniers chiffres du PIB par habitant
|
Maurice
|
Cap-Vert
|
|
|---|---|---|
| PIB par habitant, dollars US courants | 12 991 $US | 5 796 $US |
| Rang mondial | 80/197 | 116/197 |
| PIB par habitant, dollars US constants de 2015 | 12 315 $US | 4 696 $US |
| × moyenne mondiale | 0,9× | 0,4× |
| Écart de PIB par habitant | 2,2× | 0,45× |
Comparer le PIB par habitant de 2 pays au choix
Sources :
- Banque mondiale | Économie et croissance (1960–2025, mis à jour en octobre 2026)
Creative Commons Attribution (CC BY) : vous pouvez copier, partager, adapter et réutiliser ce contenu, y compris à des fins commerciales, à condition de citer statistics.wiki et d’indiquer les modifications apportées. Les sources citées ci-dessus peuvent avoir leurs propres conditions de licence.