
Madagascar vs France : PIB par habitant, 1960–2025
| Année | PIB par habitant, dollars US courants | |
|---|---|---|
 Madagascar |
 France |
|
| 2025 | 599 $ US | 48 986 $ US |
| 2024 | 550 $ US | 46 103 $ US |
| 2023 | 514 $ US | 44 700 $ US |
| 2022 | 504 $ US | 40 989 $ US |
| 2021 | 483 $ US | 43 725 $ US |
| 2020 | 451 $ US | 39 170 $ US |
| 2019 | 500 $ US | 40 408 $ US |
| 2018 | 500 $ US | 41 418 $ US |
| 2017 | 492 $ US | 38 687 $ US |
| 2016 | 454 $ US | 37 024 $ US |
| 2015 | 445 $ US | 36 702 $ US |
| 2014 | 506 $ US | 43 148 $ US |
| 2013 | 515 $ US | 42 669 $ US |
| 2012 | 494 $ US | 40 864 $ US |
| 2011 | 506 $ US | 43 930 $ US |
| 2010 | 450 $ US | 40 695 $ US |
| 2009 | 446 $ US | 41 728 $ US |
| 2008 | 513 $ US | 45 465 $ US |
| 2007 | 420 $ US | 41 486 $ US |
| 2006 | 324 $ US | 36 432 $ US |
| 2005 | 306 $ US | 34 696 $ US |
| 2004 | 272,2 $ US | 33 645 $ US |
| 2003 | 353 $ US | 29 480 $ US |
| 2002 | 305 $ US | 24 145 $ US |
| 2001 | 319 $ US | 22 332 $ US |
| 2000 | 280,3 $ US | 22 341 $ US |
| 1999 | 267,4 $ US | 24 576 $ US |
| 1998 | 284,2 $ US | 24 869 $ US |
| 1997 | 284,4 $ US | 24 169 $ US |
| 1996 | 340 $ US | 26 758 $ US |
| 1995 | 273,1 $ US | 26 792 $ US |
| 1994 | 258,7 $ US | 23 360 $ US |
| 1993 | 308 $ US | 22 239 $ US |
| 1992 | 290,2 $ US | 23 615 $ US |
| 1991 | 262 $ US | 21 501 $ US |
| 1990 | 326 $ US | 21 586 $ US |
| 1989 | 271,3 $ US | 17 547 $ US |
| 1988 | 280,5 $ US | 17 550 $ US |
| 1987 | 290,8 $ US | 16 176 $ US |
| 1986 | 405 $ US | 13 430 $ US |
| 1985 | 364 $ US | 9 657 $ US |
| 1984 | 385 $ US | 9 312 $ US |
| 1983 | 476 $ US | 9 862 $ US |
| 1982 | 501 $ US | 10 360 $ US |
| 1981 | 513 $ US | 10 956 $ US |
| 1980 | 578 $ US | 12 565 $ US |
| 1979 | 396 $ US | 11 063 $ US |
| 1978 | 315 $ US | 9 167 $ US |
| 1977 | 286,9 $ US | 7 459 $ US |
| 1976 | 273,5 $ US | 6 792 $ US |
| 1975 | 295 $ US | 6 617 $ US |
| 1974 | 255,3 $ US | 5 261 $ US |
| 1973 | 226,8 $ US | 4 907 $ US |
| 1972 | 189,6 $ US | 3 809 $ US |
| 1971 | 174,6 $ US | 3 137 $ US |
| 1970 | 166,6 $ US | 2 833 $ US |
| 1969 | 162,9 $ US | 2 729 $ US |
| 1968 | 163,6 $ US | 2 518 $ US |
| 1967 | 155,9 $ US | 2 328 $ US |
| 1966 | 150,7 $ US | 2 173 $ US |
| 1965 | 143,2 $ US | 2 024 $ US |
| 1964 | 141,5 $ US | 1 891 $ US |
| 1963 | 137,4 $ US | 1 723 $ US |
| 1962 | 137,3 $ US | 1 554 $ US |
| 1961 | 133,3 $ US | 1 402 $ US |
| 1960 | 131,7 $ US | 1 307 $ US |
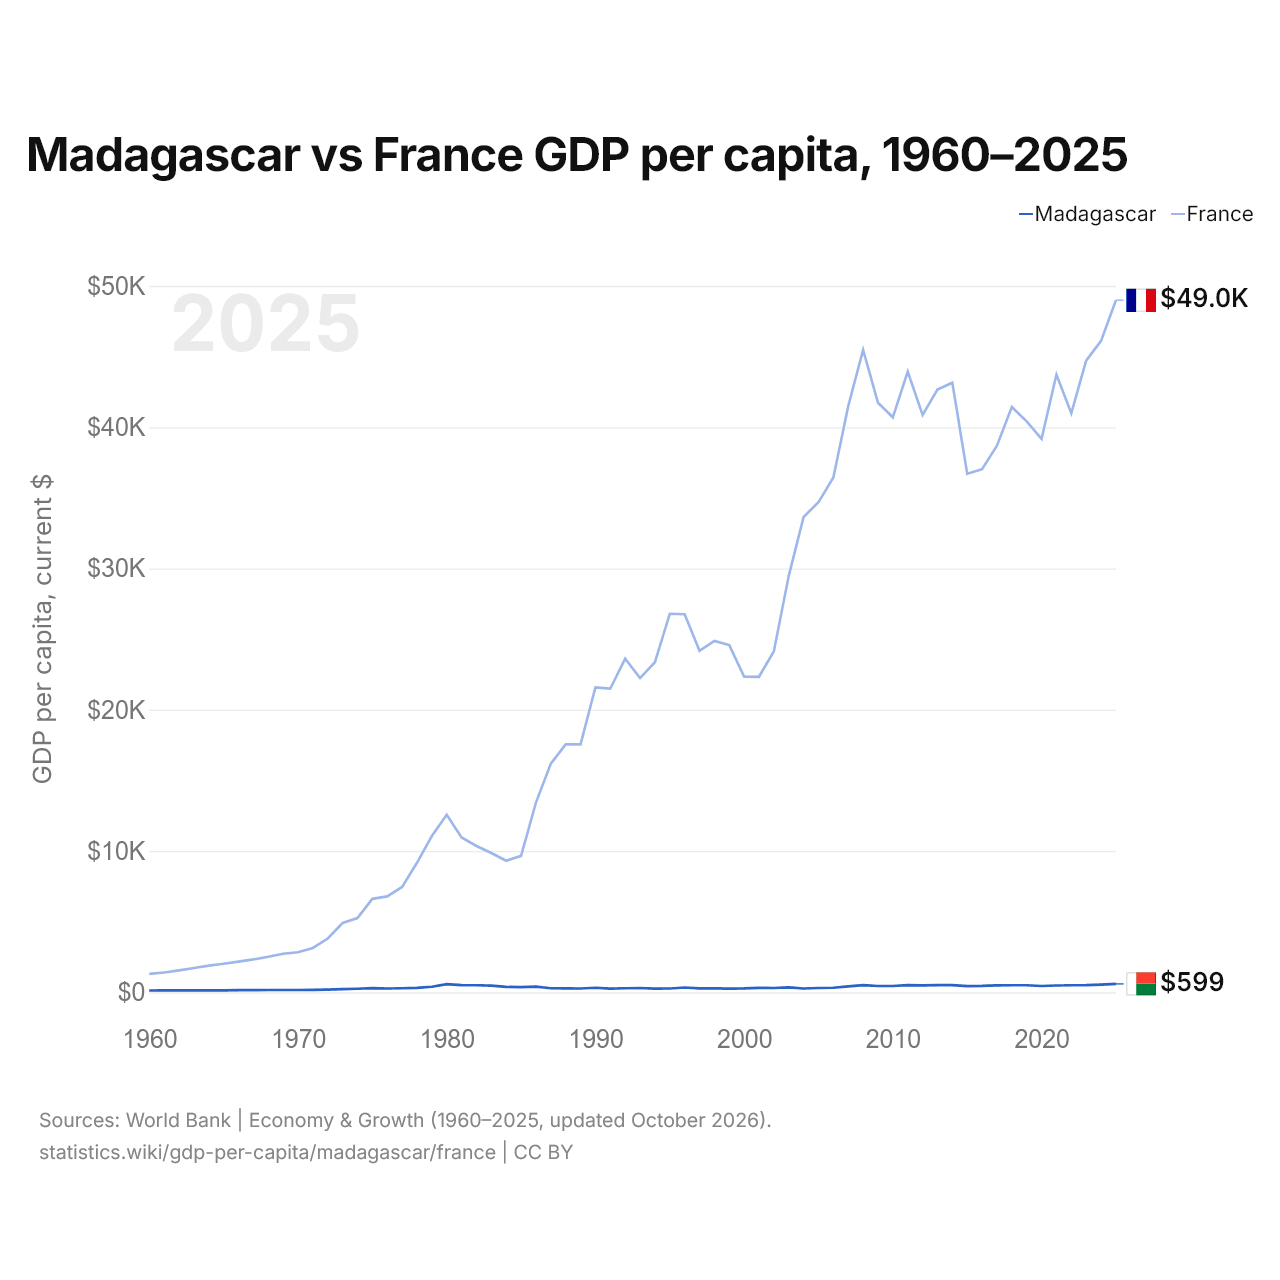
En 2025, le PIB par habitant était de 599 $ US à Madagascar et de 48 986 $ US en France : 82 fois plus élevé en France. En 1960, il était de 132 $ US à Madagascar et de 1 307 $ US en France, soit 9,9 fois plus en France.
Le PIB par habitant de la France est plus élevé que celui de Madagascar chaque année depuis 1960. À prix constants de 2015, entre 1960 et 2025, le PIB par habitant de Madagascar a reculé de 44 %, et celui de la France a progressé de 270 %.
Madagascar vs France : derniers chiffres du PIB par habitant
|
Madagascar
|
France
|
|
|---|---|---|
| PIB par habitant, dollars US courants | 599 $US | 48 986 $US |
| Rang mondial | 194/197 | 27/197 |
| PIB par habitant, dollars US constants de 2015 | 457 $US | 39 919 $US |
| × moyenne mondiale | 0,04× | 3,4× |
| Écart de PIB par habitant | 0,012× | 82× |
Comparer le PIB par habitant de 2 pays au choix
Sources :
- Banque mondiale | Économie et croissance (1960–2025, mis à jour en octobre 2026)
Creative Commons Attribution (CC BY) : vous pouvez copier, partager, adapter et réutiliser ce contenu, y compris à des fins commerciales, à condition de citer statistics.wiki et d’indiquer les modifications apportées. Les sources citées ci-dessus peuvent avoir leurs propres conditions de licence.