
Liberia vs Côte d’Ivoire : PIB, 1960–2025
| Année | PIB, dollars US courants | |
|---|---|---|
 Liberia |
 Côte d’Ivoire |
|
| 2025 | 5 245 938 900 $ US | 99 773 555 666 $ US |
| 2024 | 4 779 300 900 $ US | 87 113 179 149 $ US |
| 2023 | 4 390 000 000 $ US | 80 780 312 569 $ US |
| 2022 | 4 001 047 000 $ US | 70 922 824 814 $ US |
| 2021 | 3 513 049 500 $ US | 72 794 636 654 $ US |
| 2020 | 3 176 126 300 $ US | 63 027 852 805 $ US |
| 2019 | 3 319 596 500 $ US | 60 382 894 697 $ US |
| 2018 | 3 422 754 800 $ US | 58 522 477 787 $ US |
| 2017 | 3 390 703 400 $ US | 52 512 343 997 $ US |
| 2016 | 3 398 419 600 $ US | 48 407 761 037 $ US |
| 2015 | 3 227 075 700 $ US | 45 815 005 169 $ US |
| 2014 | 3 225 652 000 $ US | 48 843 005 614 $ US |
| 2013 | 3 177 198 100 $ US | 42 760 235 485 $ US |
| 2012 | 2 791 614 000 $ US | 36 302 302 877 $ US |
| 2011 | 2 398 000 000 $ US | 36 693 710 801 $ US |
| 2010 | 1 998 000 000 $ US | 34 936 307 980 $ US |
| 2009 | 1 768 000 000 $ US | 33 886 813 250 $ US |
| 2008 | 1 726 000 000 $ US | 34 078 240 293 $ US |
| 2007 | 1 373 000 000 $ US | 28 760 090 953 $ US |
| 2006 | 1 119 000 000 $ US | 25 281 413 263 $ US |
| 2005 | 949 000 000 $ US | 24 036 918 703 $ US |
| 2004 | 897 000 000 $ US | 23 510 575 681 $ US |
| 2003 | 748 000 000 $ US | 21 251 754 340 $ US |
| 2002 | 927 000 000 $ US | 18 054 383 321 $ US |
| 2001 | 906 000 000 $ US | 16 810 537 044 $ US |
| 2000 | 874 000 000 $ US | 16 577 533 892 $ US |
| 1999 | 441 800 000 $ US | 18 870 992 456 $ US |
| 1998 | 359 600 000 $ US | 19 619 654 756 $ US |
| 1997 | 295 900 000 $ US | 18 047 558 038 $ US |
| 1996 | 159 400 000 $ US | 18 071 152 831 $ US |
| 1995 | 134 800 000 $ US | 11 000 146 267 $ US |
| 1994 | 132 200 000 $ US | 8 313 557 510 $ US |
| 1993 | 160 400 000 $ US | 11 045 760 288 $ US |
| 1992 | 223 500 000 $ US | 11 152 971 274 $ US |
| 1991 | 348 000 000 $ US | 10 492 628 581 $ US |
| 1990 | 384 400 000 $ US | 10 795 850 583 $ US |
| 1989 | 786 300 000 $ US | 9 757 410 645 $ US |
| 1988 | 1 038 300 000 $ US | 10 255 169 806 $ US |
| 1987 | 972 800 000 $ US | 10 087 654 465 $ US |
| 1986 | 840 964 400 $ US | 9 158 302 100 $ US |
| 1985 | 851 296 100 $ US | 6 977 650 644 $ US |
| 1984 | 848 478 300 $ US | 6 841 639 247 $ US |
| 1983 | 823 374 900 $ US | 6 838 184 773 $ US |
| 1982 | 863 933 200 $ US | 7 567 110 849 $ US |
| 1981 | 846 514 500 $ US | 8 432 589 942 $ US |
| 1980 | 854 711 500 $ US | 10 175 617 609 $ US |
| 1979 | 814 067 900 $ US | 9 142 933 967 $ US |
| 1978 | 717 240 400 $ US | 7 900 526 298 $ US |
| 1977 | 673 010 600 $ US | 6 265 068 189 $ US |
| 1976 | 596 675 700 $ US | 4 662 053 825 $ US |
| 1975 | 577 549 300 $ US | 3 893 839 190 $ US |
| 1974 | 486 955 000 $ US | 3 070 152 309 $ US |
| 1973 | 386 968 300 $ US | 2 508 421 426 $ US |
| 1972 | 368 098 000 $ US | 1 849 400 402 $ US |
| 1971 | 341 543 100 $ US | 1 584 128 509 $ US |
| 1970 | 323 099 700 $ US | 1 455 482 795 $ US |
| 1969 | 306 961 800 $ US | 1 361 360 293 $ US |
| 1968 | 276 820 700 $ US | 1 281 281 277 $ US |
| 1967 | 261 024 300 $ US | 1 082 922 725 $ US |
| 1966 | 244 459 500 $ US | 1 024 102 880 $ US |
| 1965 | 229 260 800 $ US | 919 771 229 $ US |
| 1964 | 218 929 100 $ US | 921 063 327 $ US |
| 1963 | 200 229 600 $ US | 761 047 198 $ US |
| 1962 | 191 861 800 $ US | 645 284 474 $ US |
| 1961 | 183 920 900 $ US | 618 245 634 $ US |
| 1960 | 190 495 600 $ US | 546 203 559 $ US |
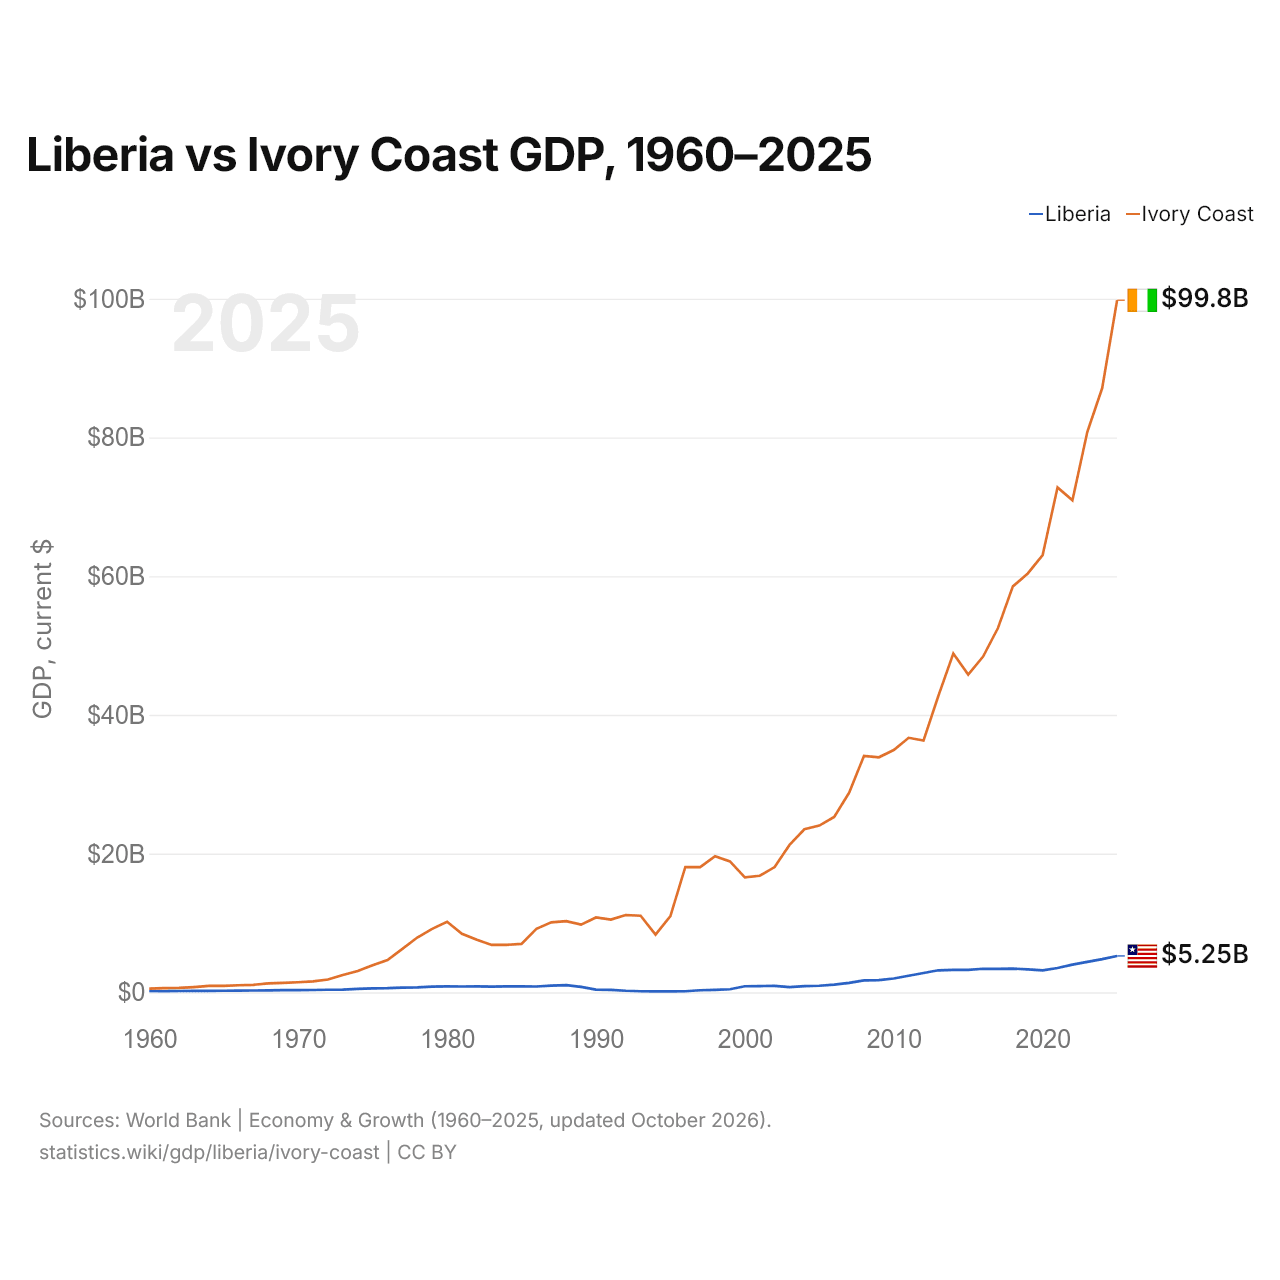
En 2025, le PIB de la Côte d’Ivoire (99,8 milliards de dollars US) était 19 fois celui du Liberia (5,25 milliards de dollars US). En 2015, le rapport était de 14. De 2015 à 2025, à prix constants de 2015, le PIB de la Côte d’Ivoire a progressé de 77,8 % et celui du Liberia de 21,5 %.
Depuis 1960, le PIB de la Côte d’Ivoire a chaque année été le plus élevé des deux ; en 1960, il était 2,9 fois celui du Liberia. En 2025, le PIB par habitant était de 915 $ US au Liberia et de 3 050 $ US en Côte d’Ivoire, soit 3,3 fois plus élevé en Côte d’Ivoire.
Liberia vs Côte d’Ivoire : derniers chiffres du PIB
|
Liberia
|
Côte d’Ivoire
|
|
|---|---|---|
| PIB, dollars US courants | 5,25 Md $US | 99,8 Md $US |
| Rang mondial | 162/197 | 77/197 |
| Part mondiale | 0,004 % | 0,08 % |
| PIB, dollars US constants de 2015 | 3,92 Md $US | 81,5 Md $US |
| Écart de PIB | 0,053× | 19× |
Comparer le PIB de 2 pays au choix
Sources :
- Banque mondiale | Économie et croissance (1960–2025, mis à jour en octobre 2026)
Creative Commons Attribution (CC BY) : vous pouvez copier, partager, adapter et réutiliser ce contenu, y compris à des fins commerciales, à condition de citer statistics.wiki et d’indiquer les modifications apportées. Les sources citées ci-dessus peuvent avoir leurs propres conditions de licence.