
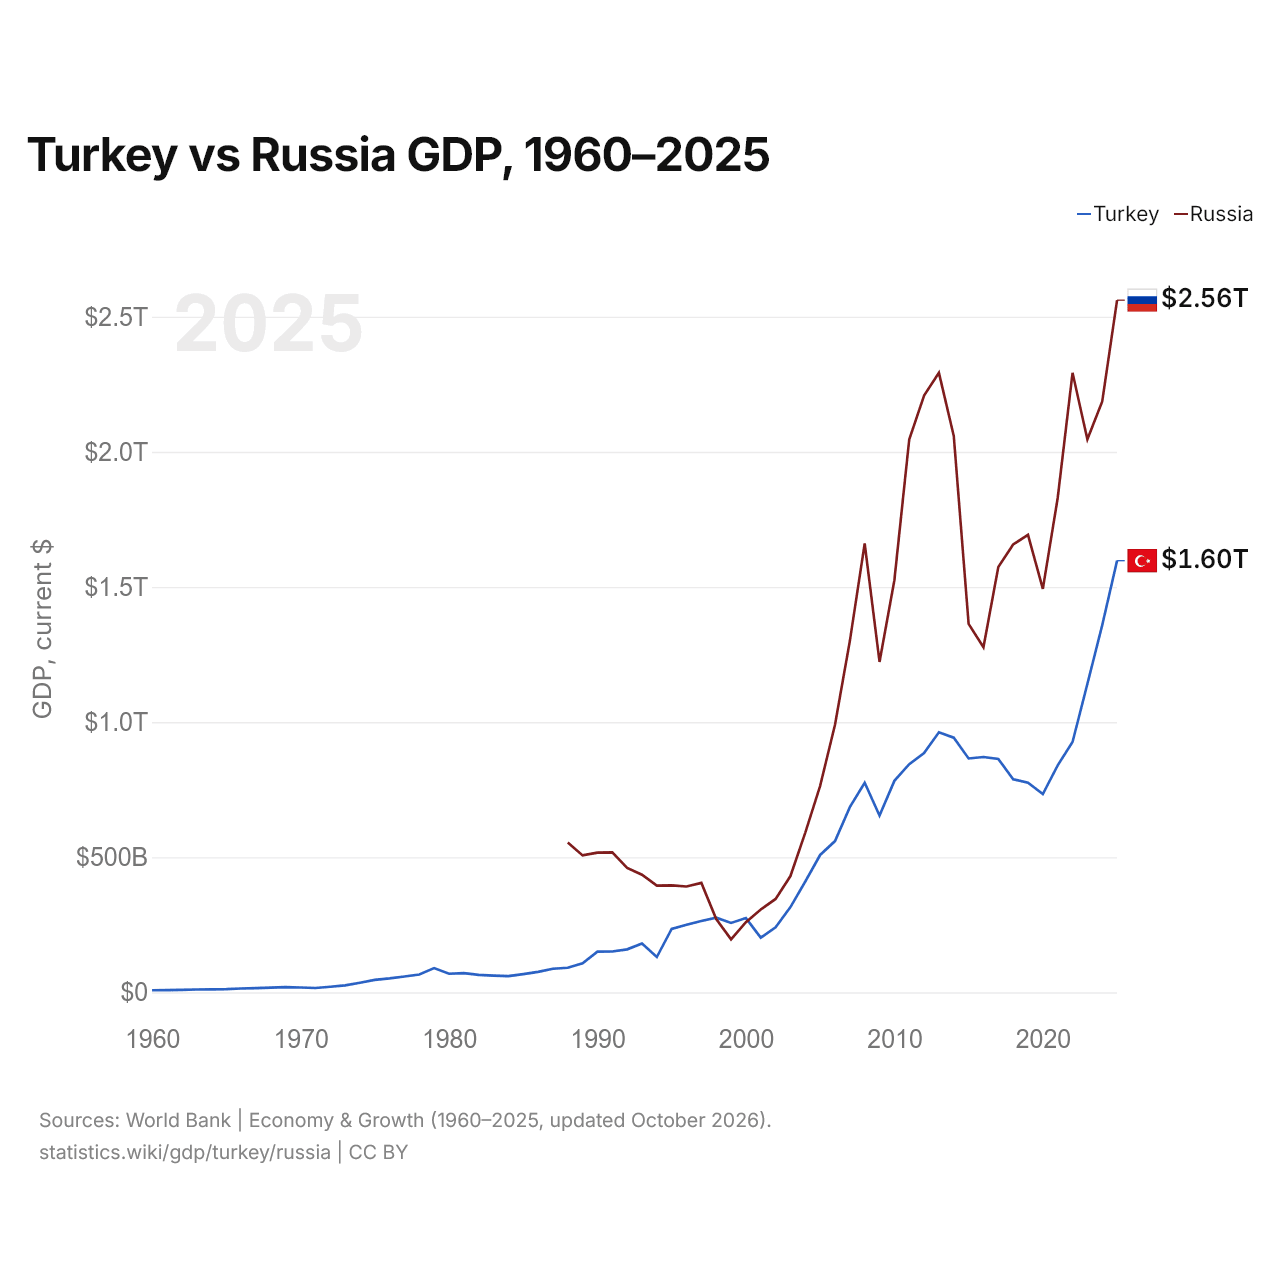
Turquie vs Russie : PIB, 1960–2025
| Année | PIB, dollars US courants | |
|---|---|---|
 Turquie |
 Russie |
|
| 2025 | 1 597 293 229 287 $ US | 2 561 310 169 359 $ US |
| 2024 | 1 359 123 768 774 $ US | 2 186 462 268 813 $ US |
| 2023 | 1 141 242 864 657 $ US | 2 046 284 838 151 $ US |
| 2022 | 926 097 476 914 $ US | 2 292 495 097 681 $ US |
| 2021 | 839 938 668 172 $ US | 1 829 186 719 575 $ US |
| 2020 | 733 628 247 119 $ US | 1 493 075 894 362 $ US |
| 2019 | 775 853 144 223 $ US | 1 693 115 002 708 $ US |
| 2018 | 788 356 985 774 $ US | 1 657 328 773 461 $ US |
| 2017 | 863 874 522 365 $ US | 1 574 199 360 089 $ US |
| 2016 | 870 818 016 910 $ US | 1 276 786 350 881 $ US |
| 2015 | 865 460 050 684 $ US | 1 363 482 182 198 $ US |
| 2014 | 942 343 431 929 $ US | 2 059 241 589 895 $ US |
| 2013 | 962 167 643 589 $ US | 2 292 470 078 346 $ US |
| 2012 | 885 327 622 479 $ US | 2 208 293 553 878 $ US |
| 2011 | 844 192 507 381 $ US | 2 045 922 753 398 $ US |
| 2010 | 782 545 664 268 $ US | 1 524 916 715 224 $ US |
| 2009 | 653 894 449 921 $ US | 1 222 645 900 056 $ US |
| 2008 | 775 415 944 333 $ US | 1 660 848 058 303 $ US |
| 2007 | 685 228 481 017 $ US | 1 299 703 478 482 $ US |
| 2006 | 559 668 118 237 $ US | 989 932 071 353 $ US |
| 2005 | 508 314 210 213 $ US | 764 015 973 481 $ US |
| 2004 | 410 156 784 496 $ US | 591 016 690 732 $ US |
| 2003 | 315 392 899 922 $ US | 430 347 420 185 $ US |
| 2002 | 240 778 008 474 $ US | 345 470 494 418 $ US |
| 2001 | 202 195 080 239 $ US | 306 602 070 621 $ US |
| 2000 | 274 748 463 179 $ US | 259 710 142 197 $ US |
| 1999 | 256 673 939 248 $ US | 195 907 128 351 $ US |
| 1998 | 276 035 372 655 $ US | 270 955 486 862 $ US |
| 1997 | 263 817 553 748 $ US | 404 928 954 192 $ US |
| 1996 | 250 366 965 174 $ US | 391 724 890 744 $ US |
| 1995 | 234 699 627 004 $ US | 395 537 185 735 $ US |
| 1994 | 130 650 447 499 $ US | 395 077 301 248 $ US |
| 1993 | 180 415 757 852 $ US | 435 083 713 851 $ US |
| 1992 | 159 104 772 992 $ US | 460 290 556 901 $ US |
| 1991 | 151 034 731 544 $ US | 517 962 962 963 $ US |
| 1990 | 150 655 500 192 $ US | 517 014 446 228 $ US |
| 1989 | 107 127 191 329 $ US | 506 631 299 735 $ US |
| 1988 | 90 875 175 809 $ US | 554 828 660 436 $ US |
| 1987 | 87 190 081 680 $ US | - |
| 1986 | 75 673 037 037 $ US | - |
| 1985 | 67 232 758 621 $ US | - |
| 1984 | 59 937 602 180 $ US | - |
| 1983 | 61 803 555 556 $ US | - |
| 1982 | 64 369 325 153 $ US | - |
| 1981 | 71 180 180 180 $ US | - |
| 1980 | 68 823 684 211 $ US | - |
| 1979 | 89 616 129 032 $ US | - |
| 1978 | 65 912 500 000 $ US | - |
| 1977 | 58 683 333 333 $ US | - |
| 1976 | 51 450 000 000 $ US | - |
| 1975 | 46 042 857 143 $ US | - |
| 1974 | 35 414 285 714 $ US | - |
| 1973 | 26 000 000 000 $ US | - |
| 1972 | 20 650 000 000 $ US | - |
| 1971 | 16 166 666 667 $ US | - |
| 1970 | 17 863 636 364 $ US | - |
| 1969 | 19 466 666 667 $ US | - |
| 1968 | 17 500 000 000 $ US | - |
| 1967 | 15 644 444 444 $ US | - |
| 1966 | 14 100 000 000 $ US | - |
| 1965 | 11 966 666 667 $ US | - |
| 1964 | 11 177 777 778 $ US | - |
| 1963 | 10 355 555 556 $ US | - |
| 1962 | 8 922 222 222 $ US | - |
| 1961 | 7 988 888 889 $ US | - |
| 1960 | 7 566 666 667 $ US | - |
En 2025, le PIB de la Russie (2,56 billions de dollars US) était 1,6 fois celui de la Turquie (1,6 billion de dollars US). En 2015, le rapport était aussi de 1,6. De 2015 à 2025, à prix constants de 2015, le PIB de la Russie a progressé de 20,1 % et celui de la Turquie de 57,6 %.
Depuis 2001, le PIB de la Russie est le plus élevé des deux ; il l'était aussi en 1988, 6,1 fois celui de la Turquie. En 2025, le PIB par habitant était de 18 599 $ US en Turquie et de 17 847 $ US en Russie, à peu près le même.
Turquie vs Russie : derniers chiffres du PIB
|
Turquie
|
Russie
|
|
|---|---|---|
| PIB, dollars US courants | 1,60 Bn $US | 2,56 Bn $US |
| Rang mondial | 16/197 | 8/197 |
| Part mondiale | 1,35 % | 2,16 % |
| PIB, dollars US constants de 2015 | 1,36 Bn $US | 1,64 Bn $US |
| Écart de PIB | 0,62× | 1,6× |
Comparer le PIB de 2 pays au choix
Sources :
- Banque mondiale | Économie et croissance (1960–2025, mis à jour en octobre 2026)
Creative Commons Attribution (CC BY) : vous pouvez copier, partager, adapter et réutiliser ce contenu, y compris à des fins commerciales, à condition de citer statistics.wiki et d’indiquer les modifications apportées. Les sources citées ci-dessus peuvent avoir leurs propres conditions de licence.