
Turquie vs Canada : PIB, 1960–2025
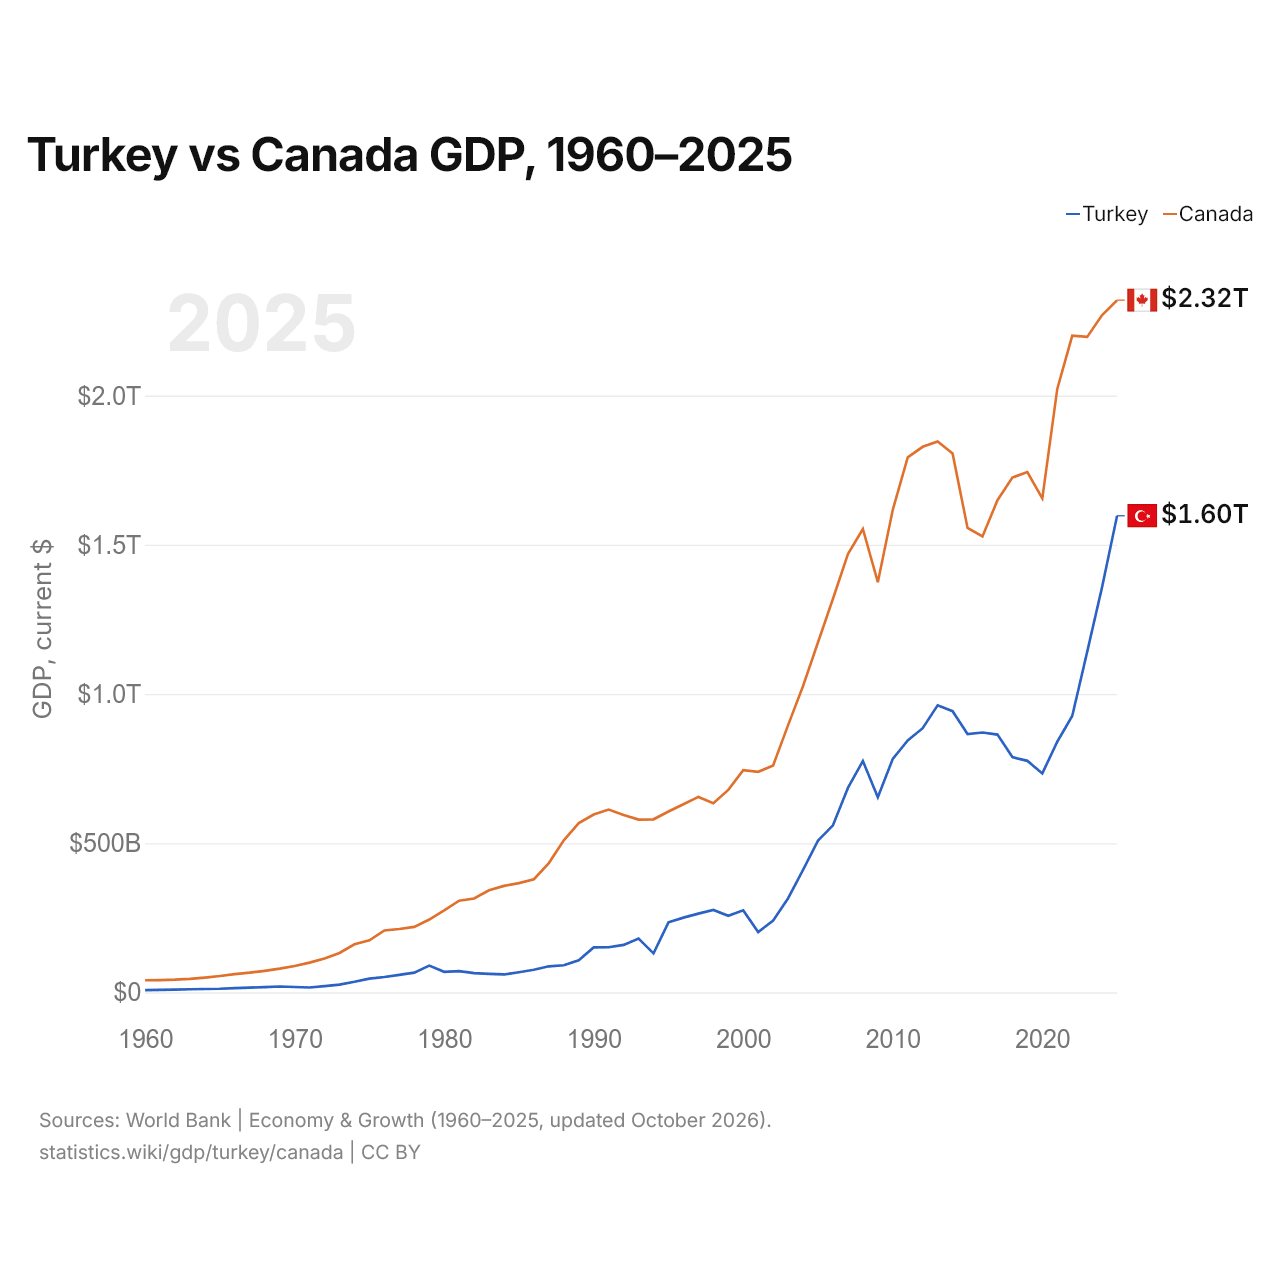
| Année | PIB, dollars US courants | |
|---|---|---|
 Turquie |
 Canada |
|
| 2025 | 1 597 293 229 287 $ US | 2 319 899 772 426 $ US |
| 2024 | 1 359 123 768 774 $ US | 2 270 076 189 683 $ US |
| 2023 | 1 141 242 864 657 $ US | 2 196 593 836 347 $ US |
| 2022 | 926 097 476 914 $ US | 2 200 562 785 046 $ US |
| 2021 | 839 938 668 172 $ US | 2 022 377 950 897 $ US |
| 2020 | 733 628 247 119 $ US | 1 655 686 966 882 $ US |
| 2019 | 775 853 144 223 $ US | 1 743 728 952 157 $ US |
| 2018 | 788 356 985 774 $ US | 1 725 330 736 238 $ US |
| 2017 | 863 874 522 365 $ US | 1 649 269 496 515 $ US |
| 2016 | 870 818 016 910 $ US | 1 527 996 250 641 $ US |
| 2015 | 865 460 050 684 $ US | 1 556 510 380 200 $ US |
| 2014 | 942 343 431 929 $ US | 1 805 751 688 809 $ US |
| 2013 | 962 167 643 589 $ US | 1 846 583 831 414 $ US |
| 2012 | 885 327 622 479 $ US | 1 828 359 477 072 $ US |
| 2011 | 844 192 507 381 $ US | 1 793 335 727 901 $ US |
| 2010 | 782 545 664 268 $ US | 1 617 349 192 091 $ US |
| 2009 | 653 894 449 921 $ US | 1 374 627 766 600 $ US |
| 2008 | 775 415 944 333 $ US | 1 552 993 439 550 $ US |
| 2007 | 685 228 481 017 $ US | 1 468 820 407 783 $ US |
| 2006 | 559 668 118 237 $ US | 1 319 291 255 289 $ US |
| 2005 | 508 314 210 213 $ US | 1 173 118 501 403 $ US |
| 2004 | 410 156 784 496 $ US | 1 026 691 006 918 $ US |
| 2003 | 315 392 899 922 $ US | 895 542 074 085 $ US |
| 2002 | 240 778 008 474 $ US | 760 650 608 552 $ US |
| 2001 | 202 195 080 239 $ US | 738 981 792 355 $ US |
| 2000 | 274 748 463 179 $ US | 744 773 415 932 $ US |
| 1999 | 256 673 939 248 $ US | 678 414 215 521 $ US |
| 1998 | 276 035 372 655 $ US | 633 999 325 918 $ US |
| 1997 | 263 817 553 748 $ US | 654 987 722 086 $ US |
| 1996 | 250 366 965 174 $ US | 630 607 994 133 $ US |
| 1995 | 234 699 627 004 $ US | 605 961 090 061 $ US |
| 1994 | 130 650 447 499 $ US | 579 944 346 807 $ US |
| 1993 | 180 415 757 852 $ US | 579 053 561 739 $ US |
| 1992 | 159 104 772 992 $ US | 594 387 358 319 $ US |
| 1991 | 151 034 731 544 $ US | 612 527 712 316 $ US |
| 1990 | 150 655 500 192 $ US | 596 075 591 361 $ US |
| 1989 | 107 127 191 329 $ US | 567 211 993 243 $ US |
| 1988 | 90 875 175 809 $ US | 509 380 027 627 $ US |
| 1987 | 87 190 081 680 $ US | 433 134 238 311 $ US |
| 1986 | 75 673 037 037 $ US | 379 006 836 992 $ US |
| 1985 | 67 232 758 621 $ US | 366 186 012 450 $ US |
| 1984 | 59 937 602 180 $ US | 356 718 400 124 $ US |
| 1983 | 61 803 555 556 $ US | 341 866 277 183 $ US |
| 1982 | 64 369 325 153 $ US | 314 647 807 409 $ US |
| 1981 | 71 180 180 180 $ US | 307 246 642 756 $ US |
| 1980 | 68 823 684 211 $ US | 274 776 566 028 $ US |
| 1979 | 89 616 129 032 $ US | 243 891 124 296 $ US |
| 1978 | 65 912 500 000 $ US | 219 369 542 386 $ US |
| 1977 | 58 683 333 333 $ US | 212 325 176 305 $ US |
| 1976 | 51 450 000 000 $ US | 207 271 612 576 $ US |
| 1975 | 46 042 857 143 $ US | 174 419 757 177 $ US |
| 1974 | 35 414 285 714 $ US | 160 949 188 139 $ US |
| 1973 | 26 000 000 000 $ US | 131 764 343 566 $ US |
| 1972 | 20 650 000 000 $ US | 113 463 848 874 $ US |
| 1971 | 16 166 666 667 $ US | 99 606 454 744 $ US |
| 1970 | 17 863 636 364 $ US | 88 192 257 632 $ US |
| 1969 | 19 466 666 667 $ US | 79 405 011 125 $ US |
| 1968 | 17 500 000 000 $ US | 72 048 833 006 $ US |
| 1967 | 15 644 444 444 $ US | 65 856 924 424 $ US |
| 1966 | 14 100 000 000 $ US | 61 252 415 405 $ US |
| 1965 | 11 966 666 667 $ US | 54 649 410 479 $ US |
| 1964 | 11 177 777 778 $ US | 49 503 663 836 $ US |
| 1963 | 10 355 555 556 $ US | 45 140 337 827 $ US |
| 1962 | 8 922 222 222 $ US | 42 336 211 556 $ US |
| 1961 | 7 988 888 889 $ US | 41 038 192 838 $ US |
| 1960 | 7 566 666 667 $ US | 40 563 768 947 $ US |
En 2025, le PIB du Canada (2,32 billions de dollars US) était supérieur de 45 % à celui de la Turquie (1,6 billion de dollars US). En 2015, le rapport était de 1,8. De 2015 à 2025, à prix constants de 2015, le PIB du Canada a progressé de 21,5 % et celui de la Turquie de 57,6 %.
Depuis 1960, le PIB du Canada a chaque année été le plus élevé des deux ; en 1960, il était 5,4 fois celui de la Turquie. En 2025, le PIB par habitant était de 18 599 $ US en Turquie et de 55 698 $ US au Canada, soit 3,0 fois plus élevé au Canada. En parité de pouvoir d'achat, l'ordre s'inverse : le PIB (PPA) est de 3,89 billions de dollars en Turquie et de 2,78 billions de dollars au Canada.
Turquie vs Canada : derniers chiffres du PIB
|
Turquie
|
Canada
|
|
|---|---|---|
| PIB, dollars US courants | 1,60 Bn $US | 2,32 Bn $US |
| Rang mondial | 16/197 | 10/197 |
| Part mondiale | 1,35 % | 1,96 % |
| PIB, dollars US constants de 2015 | 1,36 Bn $US | 1,89 Bn $US |
| Écart de PIB | 0,69× | 1,5× |
Comparer le PIB de 2 pays au choix
Sources :
- Banque mondiale | Économie et croissance (1960–2025, mis à jour en octobre 2026)
Creative Commons Attribution (CC BY) : vous pouvez copier, partager, adapter et réutiliser ce contenu, y compris à des fins commerciales, à condition de citer statistics.wiki et d’indiquer les modifications apportées. Les sources citées ci-dessus peuvent avoir leurs propres conditions de licence.