
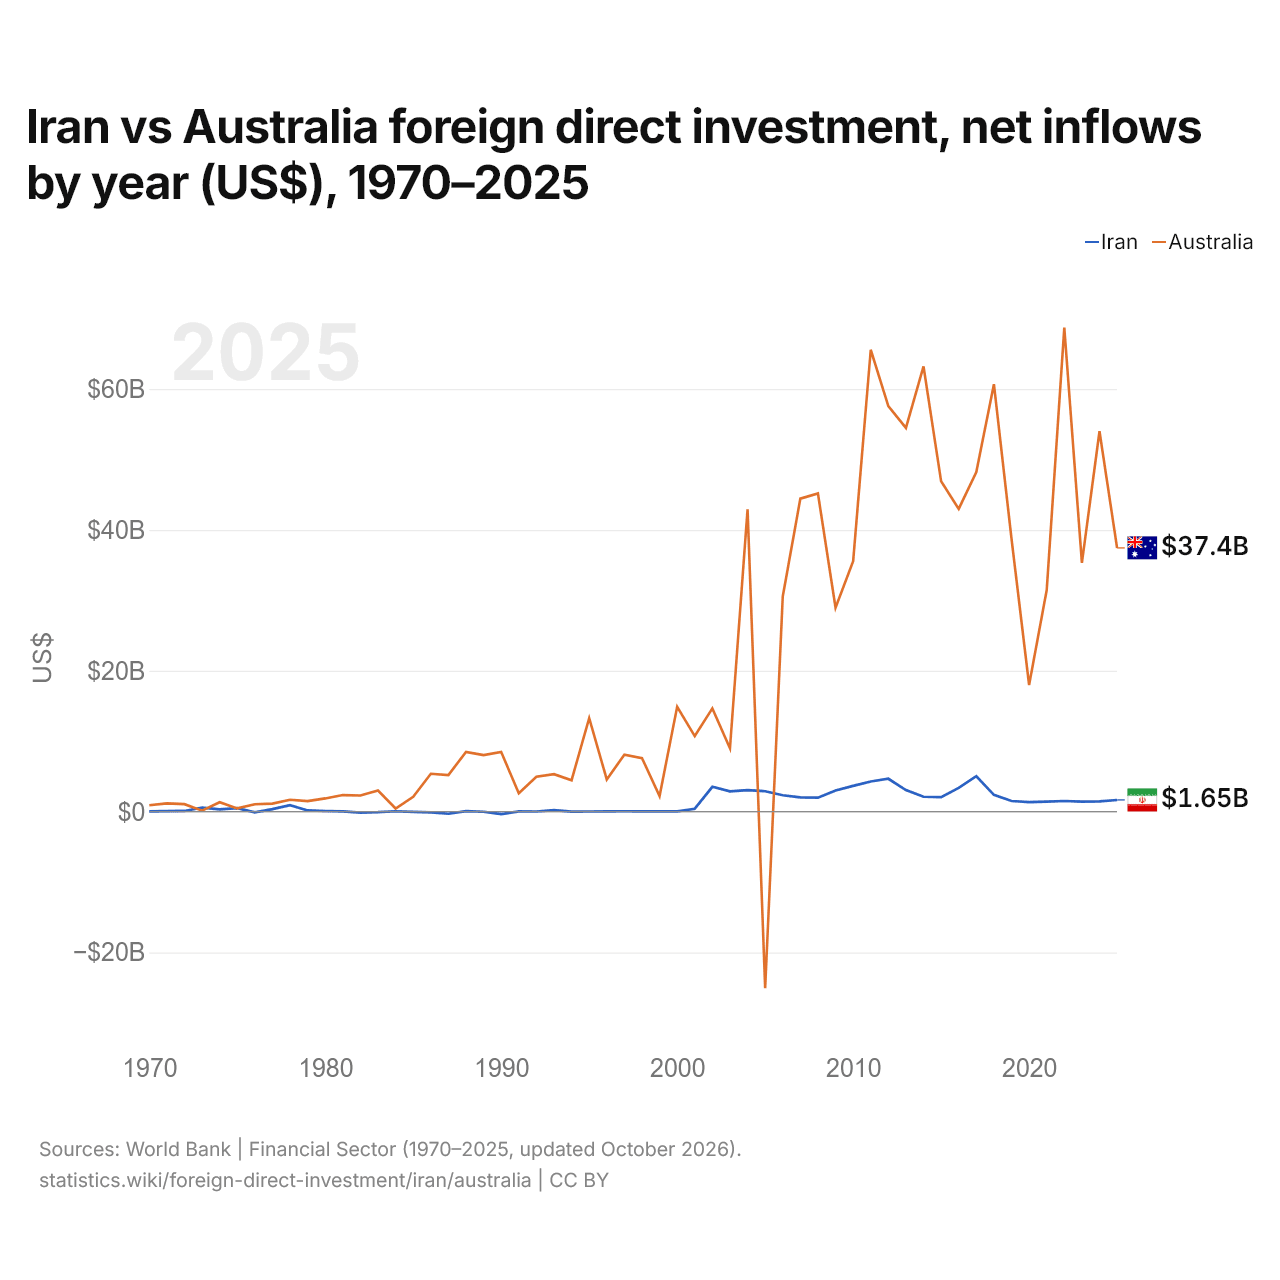
Iran vs Australie : investissements directs étrangers, entrées nettes par année ($ US), 1970–2025
| Année | $ US | |
|---|---|---|
 Iran |
 Australie |
|
| 2025 | 1 646 577 407 $ US | 37 438 451 003 $ US |
| 2024 | 1 449 111 111 $ US | 54 000 207 993 $ US |
| 2023 | 1 422 333 333 $ US | 35 315 978 153 $ US |
| 2022 | 1 500 000 000 $ US | 68 709 419 797 $ US |
| 2021 | 1 425 000 000 $ US | 31 453 060 427 $ US |
| 2020 | 1 342 000 000 $ US | 17 976 843 681 $ US |
| 2019 | 1 508 000 000 $ US | 38 745 129 661 $ US |
| 2018 | 2 373 000 000 $ US | 60 686 639 530 $ US |
| 2017 | 5 019 000 000 $ US | 48 199 372 040 $ US |
| 2016 | 3 372 000 000 $ US | 42 970 225 978 $ US |
| 2015 | 2 050 000 000 $ US | 46 892 808 568 $ US |
| 2014 | 2 105 494 000 $ US | 63 204 516 348 $ US |
| 2013 | 3 049 945 000 $ US | 54 472 699 004 $ US |
| 2012 | 4 661 734 400 $ US | 57 571 285 655 $ US |
| 2011 | 4 276 718 690 $ US | 65 578 266 556 $ US |
| 2010 | 3 648 972 410 $ US | 35 554 698 682 $ US |
| 2009 | 2 983 421 910 $ US | 28 932 973 453 $ US |
| 2008 | 1 979 988 010 $ US | 45 170 097 261 $ US |
| 2007 | 2 017 791 750 $ US | 44 440 876 037 $ US |
| 2006 | 2 317 538 500 $ US | 30 551 100 657 $ US |
| 2005 | 2 889 191 670 $ US | −25 093 141 435 $ US |
| 2004 | 3 037 299 840 $ US | 42 907 672 820 $ US |
| 2003 | 2 877 481 500 $ US | 8 985 246 030 $ US |
| 2002 | 3 519 380 360 $ US | 14 656 321 801 $ US |
| 2001 | 408 118 760 $ US | 10 717 133 151 $ US |
| 2000 | 39 000 000 $ US | 14 892 978 180 $ US |
| 1999 | 35 000 000 $ US | 2 210 917 992 $ US |
| 1998 | 24 000 000 $ US | 7 597 610 928 $ US |
| 1997 | 53 000 000 $ US | 8 088 068 983 $ US |
| 1996 | 26 000 000 $ US | 4 563 952 446 $ US |
| 1995 | 17 000 000 $ US | 13 268 875 155 $ US |
| 1994 | 2 000 000 $ US | 4 458 484 244 $ US |
| 1993 | 207 550 000 $ US | 5 312 435 142 $ US |
| 1992 | 8 500 000 $ US | 4 941 906 672 $ US |
| 1991 | 22 590 000 $ US | 2 612 066 526 $ US |
| 1990 | −361 950 000 $ US | 8 457 776 860 $ US |
| 1989 | −19 420 000 $ US | 8 023 170 407 $ US |
| 1988 | 60 540 000 $ US | 8 476 377 245 $ US |
| 1987 | −307 630 000 $ US | 5 190 522 203 $ US |
| 1986 | −112 440 000 $ US | 5 369 760 089 $ US |
| 1985 | −38 150 000 $ US | 2 098 624 894 $ US |
| 1984 | 42 690 000 $ US | 428 250 491 $ US |
| 1983 | −78 520 000 $ US | 2 990 964 045 $ US |
| 1982 | −136 090 000 $ US | 2 286 321 730 $ US |
| 1981 | 28 220 000 $ US | 2 346 546 543 $ US |
| 1980 | 80 910 000 $ US | 1 866 223 965 $ US |
| 1979 | 164 350 000 $ US | 1 489 983 133 $ US |
| 1978 | 909 060 000 $ US | 1 676 855 615 $ US |
| 1977 | 345 690 000 $ US | 1 141 019 599 $ US |
| 1976 | −101 590 000 $ US | 1 047 313 647 $ US |
| 1975 | 494 400 000 $ US | 449 028 697 $ US |
| 1974 | 323 500 000 $ US | 1 327 729 912 $ US |
| 1973 | 561 500 000 $ US | 135 039 666 $ US |
| 1972 | 91 200 000 $ US | 1 054 014 675 $ US |
| 1971 | 65 200 000 $ US | 1 155 158 059 $ US |
| 1970 | 28 000 000 $ US | 893 138 536 $ US |
En 2025, les entrées nettes d'investissements directs étrangers étaient de 1,65 milliard de dollars en Iran et de 37,4 milliards de dollars en Australie : 23 fois plus en Australie. En 1970, elles étaient de 28 millions de dollars en Iran et de 893 millions de dollars en Australie.
Les entrées nettes d'investissements directs étrangers en Iran ont été supérieures à celles de l'Australie pendant 3 des 56 années de 1970 à 2025, et inférieures pendant 53.
Iran vs Australie : dernières entrées et sorties d'investissements étrangers
|
Iran
|
Australie
|
|
|---|---|---|
| Entrées nettes | +1,65 Md $US | +37,4 Md $US |
| Entrées nettes, % du PIB | +0,5 % | +2,1 % |
| Sorties nettes | +104 M $US | −6,75 Md $US |
| Entrées nettes, total 2016–2025 | +21,1 Md $US | +435 Md $US |
| Rang mondial | 78/192 | 14/192 |
Comparer les investissements directs étrangers de 2 pays au choix
Sources :
- Banque mondiale | Secteur financier (1970–2025, mis à jour en octobre 2026)
Creative Commons Attribution (CC BY) : vous pouvez copier, partager, adapter et réutiliser ce contenu, y compris à des fins commerciales, à condition de citer statistics.wiki et d’indiquer les modifications apportées. Les sources citées ci-dessus peuvent avoir leurs propres conditions de licence.