
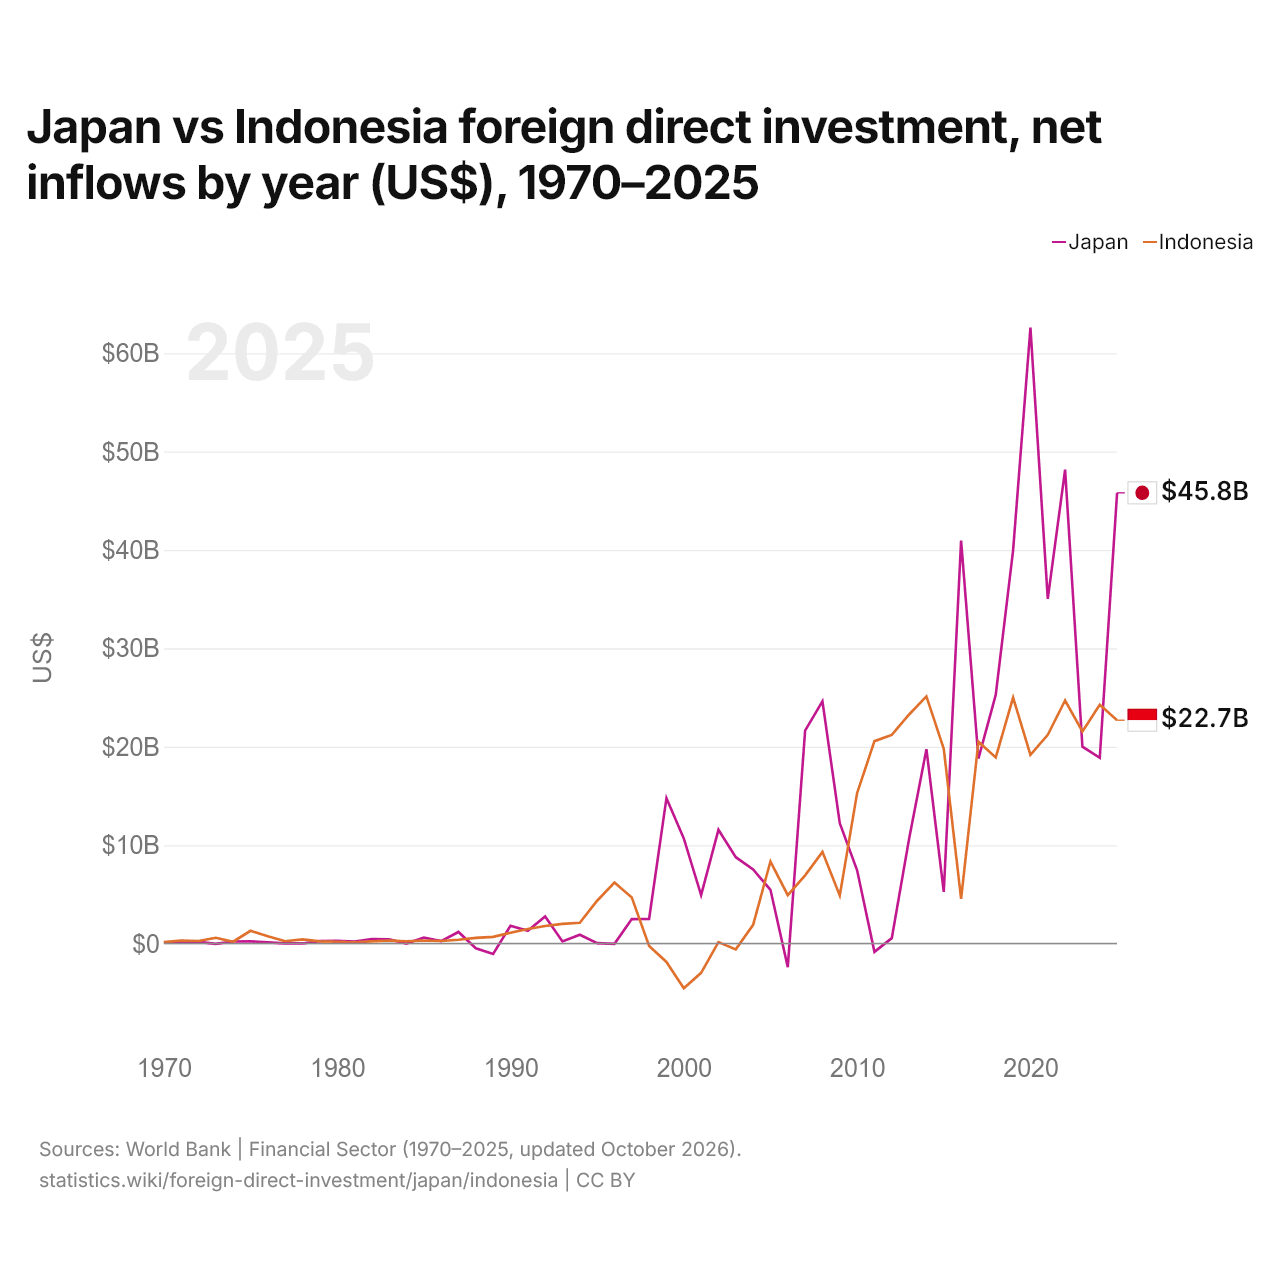
Japon vs Indonésie : investissements directs étrangers, entrées nettes par année ($ US), 1970–2025
| Année | $ US | |
|---|---|---|
 Japon |
 Indonésie |
|
| 2025 | 45 805 721 095 $ US | 22 698 158 405 $ US |
| 2024 | 18 874 093 729 $ US | 24 275 445 280 $ US |
| 2023 | 20 007 989 123 $ US | 21 543 358 781 $ US |
| 2022 | 48 153 832 744 $ US | 24 702 029 705 $ US |
| 2021 | 35 027 163 876 $ US | 21 213 080 330 $ US |
| 2020 | 62 584 719 398 $ US | 19 175 077 748 $ US |
| 2019 | 39 960 544 340 $ US | 24 993 551 748 $ US |
| 2018 | 25 289 367 858 $ US | 18 909 826 044 $ US |
| 2017 | 18 802 251 208 $ US | 20 510 310 832 $ US |
| 2016 | 40 954 181 469 $ US | 4 541 713 739 $ US |
| 2015 | 5 252 218 412 $ US | 19 779 127 977 $ US |
| 2014 | 19 752 249 424 $ US | 25 120 732 060 $ US |
| 2013 | 10 648 441 636 $ US | 23 281 742 362 $ US |
| 2012 | 546 962 692 $ US | 21 200 778 608 $ US |
| 2011 | −850 717 035 $ US | 20 564 938 227 $ US |
| 2010 | 7 440 979 284 $ US | 15 292 009 411 $ US |
| 2009 | 12 226 471 579 $ US | 4 877 369 178 $ US |
| 2008 | 24 624 845 330 $ US | 9 318 453 650 $ US |
| 2007 | 21 631 204 436 $ US | 6 928 480 000 $ US |
| 2006 | −2 396 909 736 $ US | 4 914 201 435 $ US |
| 2005 | 5 459 618 343 $ US | 8 336 257 208 $ US |
| 2004 | 7 527 948 175 $ US | 1 896 082 770 $ US |
| 2003 | 8 771 535 612 $ US | −596 923 828 $ US |
| 2002 | 11 557 373 874 $ US | 145 085 549 $ US |
| 2001 | 4 926 033 619 $ US | −2 977 391 857 $ US |
| 2000 | 10 688 168 326 $ US | −4 550 355 286 $ US |
| 1999 | 14 780 510 031 $ US | −1 865 620 963 $ US |
| 1998 | 2 512 021 924 $ US | −240 800 000 $ US |
| 1997 | 2 486 935 040 $ US | 4 677 000 000 $ US |
| 1996 | −38 203 596 $ US | 6 194 000 000 $ US |
| 1995 | 41 463 072 $ US | 4 346 000 000 $ US |
| 1994 | 888 384 471 $ US | 2 109 000 000 $ US |
| 1993 | 210 435 439 $ US | 2 004 000 000 $ US |
| 1992 | 2 755 603 983 $ US | 1 777 000 000 $ US |
| 1991 | 1 284 268 820 $ US | 1 482 000 000 $ US |
| 1990 | 1 806 039 008 $ US | 1 093 000 000 $ US |
| 1989 | −1 059 696 732 $ US | 682 000 000 $ US |
| 1988 | −483 800 487 $ US | 576 000 000 $ US |
| 1987 | 1 177 422 254 $ US | 385 000 000 $ US |
| 1986 | 242 107 762 $ US | 258 000 000 $ US |
| 1985 | 608 713 150 $ US | 310 000 000 $ US |
| 1984 | −10 000 000 $ US | 222 000 000 $ US |
| 1983 | 416 000 000 $ US | 292 000 000 $ US |
| 1982 | 439 000 000 $ US | 225 000 000 $ US |
| 1981 | 189 000 000 $ US | 133 000 000 $ US |
| 1980 | 278 000 000 $ US | 180 000 000 $ US |
| 1979 | 239 000 000 $ US | 226 000 000 $ US |
| 1978 | 8 000 000 $ US | 417 710 000 $ US |
| 1977 | 21 000 000 $ US | 235 000 000 $ US |
| 1976 | 113 000 000 $ US | 747 590 000 $ US |
| 1975 | 226 000 000 $ US | 1 292 060 000 $ US |
| 1974 | 202 000 000 $ US | 182 120 000 $ US |
| 1973 | −42 000 000 $ US | 581 000 000 $ US |
| 1972 | 169 000 000 $ US | 253 520 000 $ US |
| 1971 | 210 000 000 $ US | 299 070 000 $ US |
| 1970 | 94 000 000 $ US | 145 380 000 $ US |
En 2025, les entrées nettes d'investissements directs étrangers étaient de 45,8 milliards de dollars au Japon et de 22,7 milliards de dollars en Indonésie : 2,0 fois plus au Japon. En 1970, elles étaient de 94 millions de dollars au Japon et de 145 millions de dollars en Indonésie.
Les entrées nettes d'investissements directs étrangers au Japon ont été supérieures à celles de l'Indonésie pendant 27 des 56 années de 1970 à 2025, et inférieures pendant 29.
Japon vs Indonésie : dernières entrées et sorties d'investissements étrangers
|
Japon
|
Indonésie
|
|
|---|---|---|
| Entrées nettes | +45,8 Md $US | +22,7 Md $US |
| Entrées nettes, % du PIB | +1,0 % | +1,6 % |
| Sorties nettes | +218 Md $US | +8,15 Md $US |
| Entrées nettes, total 2016–2025 | +355 Md $US | +203 Md $US |
| Rang mondial | 10/192 | 19/192 |
Comparer les investissements directs étrangers de 2 pays au choix
Sources :
- Banque mondiale | Secteur financier (1970–2025, mis à jour en octobre 2026)
Creative Commons Attribution (CC BY) : vous pouvez copier, partager, adapter et réutiliser ce contenu, y compris à des fins commerciales, à condition de citer statistics.wiki et d’indiquer les modifications apportées. Les sources citées ci-dessus peuvent avoir leurs propres conditions de licence.